Feature Overview
PnL Preview provides a visual representation of option profit and loss under different underlying price scenarios before placing an order. It helps users clearly understand the potential return profile and risk structure of a trading strategy prior to expiration.
 Through the PnL curve, users can quickly identify:
- The strategy’s breakeven points
- Maximum potential loss and upside profit
- Changes in risk exposure and returns across different price ranges
This feature is designed to reduce the complexity of strategy evaluation and support more informed risk assessment and decision-making before trading.
Chart Explanation
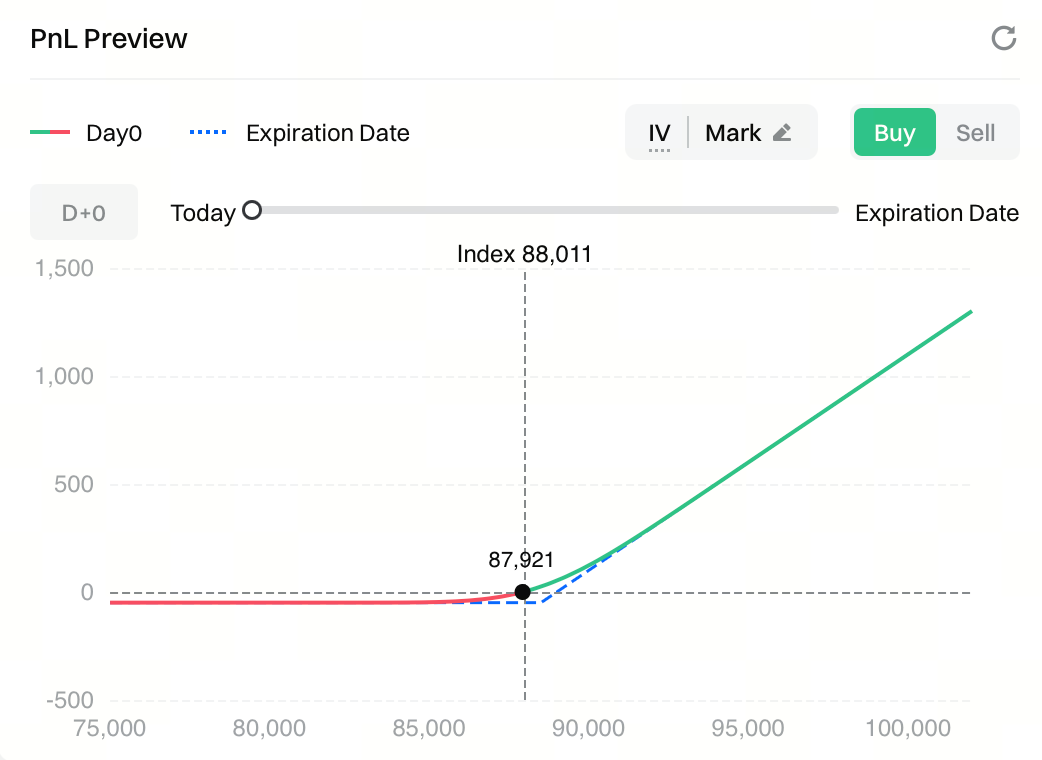
The PnL preview chart illustrates how an option’s profit and loss changes across different underlying price levels.
- X-axis | Underlying Price (Index Price) Represents the possible price range of the underlying at expiration or a selected point in time, helping users determine whether the strategy is profitable or loss-making at each price level.
- Y-axis | Profit & Loss (PnL) Shows the profit or loss at each price level, denominated in the same currency used for trading (e.g. USDT).
The chart includes two key curves:
- Day 0 / Day X (solid line) Displays the theoretical PnL at the current moment or after holding the contract for X days. The Day X value can be adjusted using the time slider.
- Expiration (dashed line) Shows the PnL at option expiration, calculated purely based on settlement logic and excluding time value.
Additional reference markers include:
- Index dashed line : Current underlying index price
- Black marker : Instant theoretical PnL at the current price
- Zero line (0 axis) : Breakeven reference line used to identify profitable and loss-making regions
Interaction Guide
- Buy / Sell Toggle Switch between Buy and Sell to change the strategy direction. The PnL curve updates in real time to reflect long or short payoff structures.
- Time Selection Use the time slider to simulate PnL after holding the option for different numbers of days and observe how profit and loss evolve over time.
- IV Adjustment By default, calculations are based on the contract’s marked implied volatility (IV). Users can manually edit the IV parameter to recalculate PnL, enabling evaluation of how IV changes impact option value and returns.
- Price Range Slider Adjust the displayed price range of the PnL chart to zoom in on key areas (such as near the strike price). This affects analysis only and does not impact order placement.
Use Case Examples
-
Use Case 1: Identifying Breakeven Points By locating where the PnL curve intersects the zero line, users can quickly determine the price range where the strategy becomes profitable and assess the safety margin relative to the current price.
-
Use Case 2: Evaluating Maximum Risk
-
For option buyers, the maximum loss is typically limited to the premium paid.
-
For option sellers, the slope and extension of the PnL curve help visualize potential risk exposure.
-
Use Case 3: Comparing Short-Term vs. Expiration Risk Profiles
-
The Day 0 / Day X curve reflects short-term risks from price movement and IV changes.
-
The expiration curve shows the final settlement outcome.
-
The difference between the two helps illustrate the effects of time decay (Theta) and volatility sensitivity (Vega).
Notes
-
PnL Preview is based on theoretical pricing models. Actual trading results may differ due to:
-
Market liquidity conditions
-
Execution slippage
-
Rapid changes in implied volatility (IV)
-
This feature is intended for informational and decision-support purposes only and does not constitute any guarantee of returns or investment advice.
Disclaimer
The content provided herein is for reference and educational purposes only and does not constitute any financial, investment, trading, or legal advice, nor does it constitute an offer or solicitation to buy or sell any digital assets. Gate makes no express or implied representations or warranties regarding the accuracy, completeness, or timeliness of the information contained herein. Product features, interfaces, rules, and fee structures may be updated or adjusted at any time. Please refer to the latest announcements and the actual information displayed on the Gate platform for the most accurate details.
Digital asset investments involve significant risk, and prices may fluctuate substantially. You may lose the entire amount of your investment. Please make decisions cautiously based on your own financial situation and risk tolerance after fully understanding the associated risks. If necessary, you are advised to consult an independent professional financial or legal advisor.
For more information about potential risks, please refer to Gate's Risk Disclosure and User Agreement.
