El aumento de Stellar (XLM) se desvaneció rápidamente cuando el precio cayó más del 6% en la última semana, eliminando por completo el impulso a corto plazo.
A pesar de haber aumentado un 41% en tres meses, la tendencia muestra que los vendedores están recuperando el control. Además, las esperanzas de recuperación en este momento dependen de un factor frágil y bastante difícil de ocurrir.
Cruce de EMA emite señal de advertencia - Los osos aumentan su fuerza
En el gráfico de 4 horas, el precio de XLM ha caído por debajo de las cuatro líneas EMA: las medias móviles exponenciales de 20, 50, 100 y 200 períodos. Lo más notable es que se ha formado un death cross, en el que la línea EMA de 50 (color naranja) ha caído por debajo de la línea EMA de 100 (color azul claro).
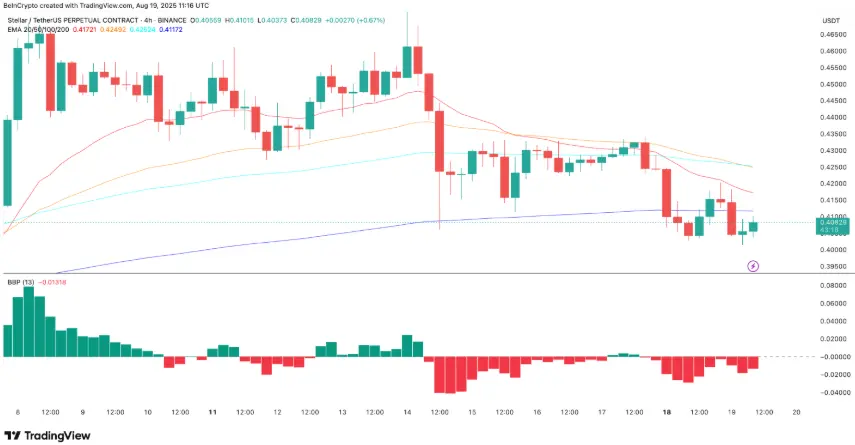 Precio de XLM y cruce de caída | Fuente: TradingViewLa media móvil exponencial (EMA) se centra más en los datos de precios recientes. Cuando la línea EMA a corto plazo cruza por debajo de la línea EMA a largo plazo, se considera una señal bajista, lo que indica que el precio reciente está cayendo más rápido que la tendencia a largo plazo.
Cuando las medias móviles a corto plazo como la EMA 50 caen por debajo de las medias móviles a largo plazo como la EMA 100, a menudo se considera un cambio de impulso, cuando los compradores pierden el control y los vendedores comienzan a dominar. Pero eso no es todo.
El indicador Bull-Bear Power (BBP) en el mismo gráfico también muestra una señal roja intensa, lo que significa que los osos han controlado completamente la estructura de precios a corto plazo.
Hasta ahora, el movimiento del precio muestra debilidad. Pero esa es solo la mitad de la historia.
Gráfico de liquidación: los cortos dominan, pero también son la única esperanza
En Bitget, XLM ha visto casi 75,82 millones de USD en posiciones cortas y casi 20 millones de USD en órdenes largas liquidadas en los últimos 7 días, lo que muestra una fuerte tendencia a la caída en las posiciones de los traders.
Sin embargo, esta también es una rara oportunidad para los toros. Si el mercado en general se recupera levemente, podría ocurrir un short squeeze: el aumento de precios obligaría a cerrar las posiciones cortas, creando una ola de compras forzadas, elevando fuertemente el precio de XLM.
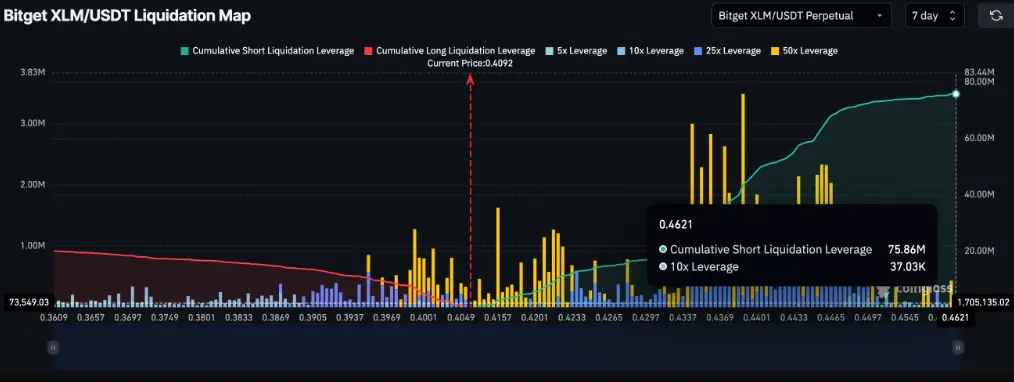 Gráfico de liquidación de XLM | Fuente: CoinglassEl short squeeze ocurre cuando demasiados traders apuestan a que el precio caerá (abriendo posiciones cortas), pero en cambio, el precio sube, obligándolos a comprar de nuevo apresuradamente. Esta compra desesperada ayuda a empujar repentinamente el precio hacia arriba.
Hitos importantes a seguir
XLM ha roto recientemente el patrón de bandera en el gráfico diario. El nivel de soporte más cercano actualmente es $0,40. Si se pierde este nivel, el cruce a la baja y la presión de BBP podrían llevar el precio a $0,36 en las próximas sesiones de trading.
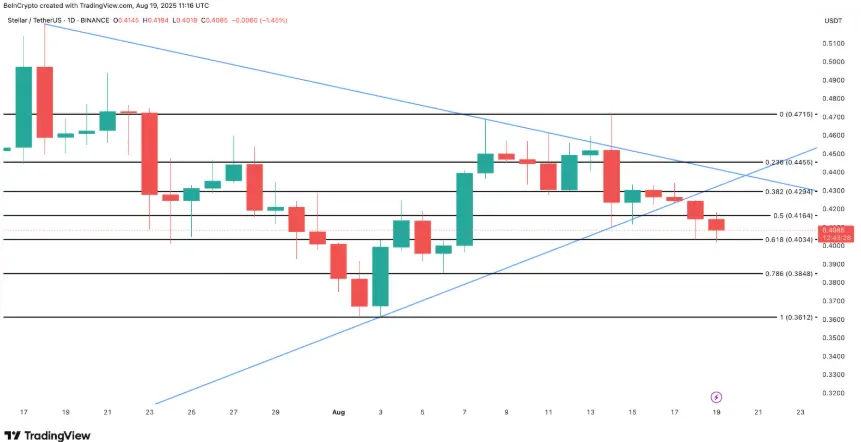 Análisis técnico de XLM | Fuente: TradingViewSin embargo, si realmente ocurre un Short squeeze y XLM recupera el rango de $0,42 a $0,44, entonces la estructura de caída a corto plazo se invalidará. Esto revertirá el sentimiento a corto plazo y podría activar fuertes compras.
Sin embargo, hasta que eso ocurra, los osos aún controlan el mercado.
Vincent
Aviso legal: La información de esta página puede proceder de terceros y no representa los puntos de vista ni las opiniones de Gate. El contenido que aparece en esta página es solo para fines informativos y no constituye ningún tipo de asesoramiento financiero, de inversión o legal. Gate no garantiza la exactitud ni la integridad de la información y no se hace responsable de ninguna pérdida derivada del uso de esta información. Las inversiones en activos virtuales conllevan riesgos elevados y están sujetas a una volatilidad significativa de los precios. Podrías perder todo el capital invertido. Asegúrate de entender completamente los riesgos asociados y toma decisiones prudentes de acuerdo con tu situación financiera y tu tolerancia al riesgo. Para obtener más información, consulta el
Aviso legal.
