TonyTheBull
Пока нет содержимого
TonyTheBull
Некоторые называют 10 октября в криптовалюте Черным лебедем и сравнивают его с COVID, специально указывая на это сравнение как на причину, по которой цена вырастет
Через 42 дня Bitcoin упал на -33%
Через 42 дня после COVID Bitcoin восстановил почти все потерянное
Через 42 дня Bitcoin упал на -33%
Через 42 дня после COVID Bitcoin восстановил почти все потерянное
BTC-0,35%
- Награда
- лайк
- комментарий
- Репост
- Поделиться
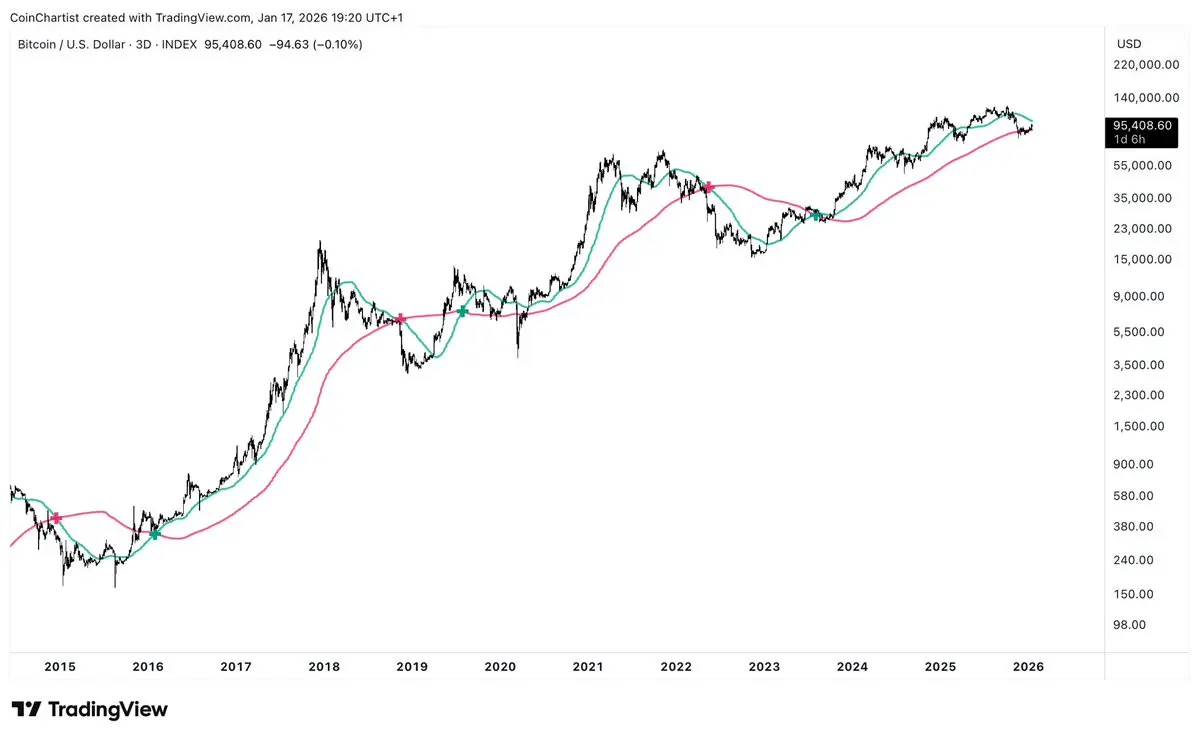
Мертвая пересечение 50/100 SMA распространяется по низким таймфреймам
Сначала дневной график в ноябре, затем двухдневный в конце декабря
Ожидание подтверждения на 3-дневном графике исторически означало реакцию после того, как основная часть снижения уже завершилась
Здесь стоит проявлять осторожность, поскольку пересечение на 3-дневном графике приближается
Двухдневный график исторически показывал просадки в диапазоне -50% до -62% после пересечения
Посмотреть ОригиналСначала дневной график в ноябре, затем двухдневный в конце декабря
Ожидание подтверждения на 3-дневном графике исторически означало реакцию после того, как основная часть снижения уже завершилась
Здесь стоит проявлять осторожность, поскольку пересечение на 3-дневном графике приближается
Двухдневный график исторически показывал просадки в диапазоне -50% до -62% после пересечения
- Награда
- лайк
- комментарий
- Репост
- Поделиться
Перепроверка всех перепроверок?
Посмотреть Оригинал
- Награда
- лайк
- комментарий
- Репост
- Поделиться
Кажется, это эмоциональный прогресс
Время покажет
Посмотреть ОригиналВремя покажет
- Награда
- лайк
- комментарий
- Репост
- Поделиться
Это не может быть так очевидно, не так ли?
Посмотреть Оригинал- Награда
- лайк
- комментарий
- Репост
- Поделиться
Bait
Теперь я жду
Посмотреть ОригиналТеперь я жду
- Награда
- лайк
- комментарий
- Репост
- Поделиться
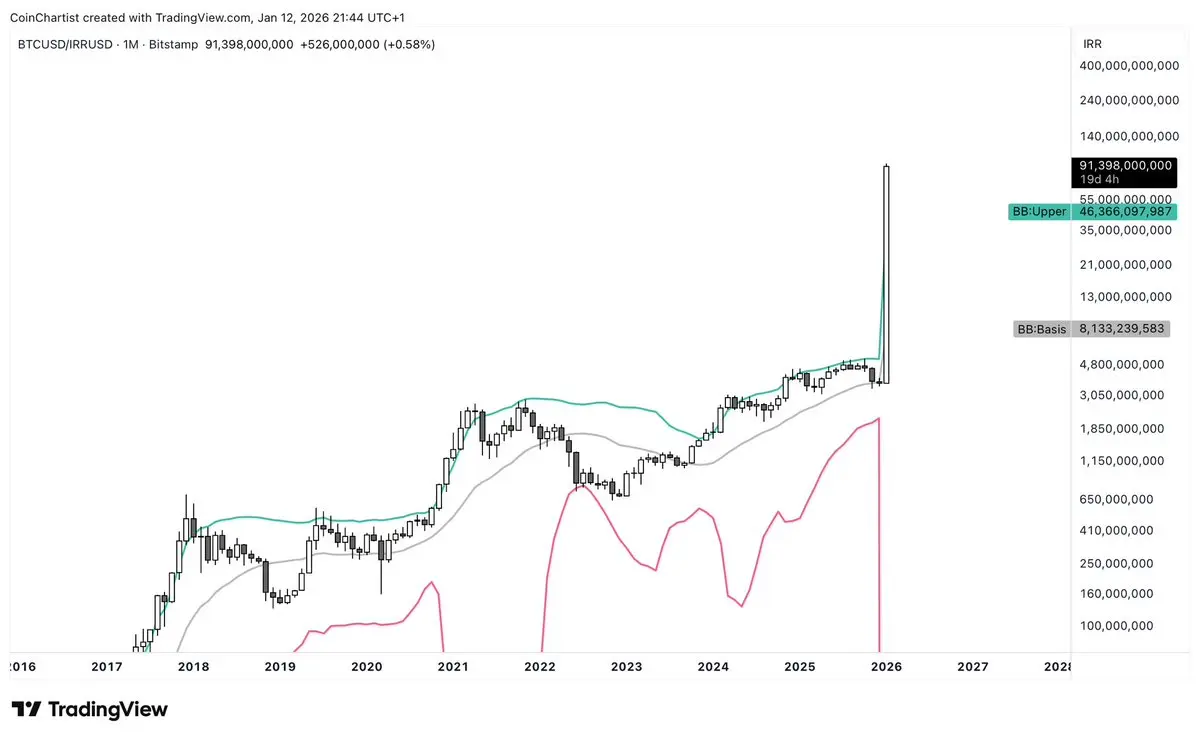
Litecoin против иранского риала
Посмотреть Оригинал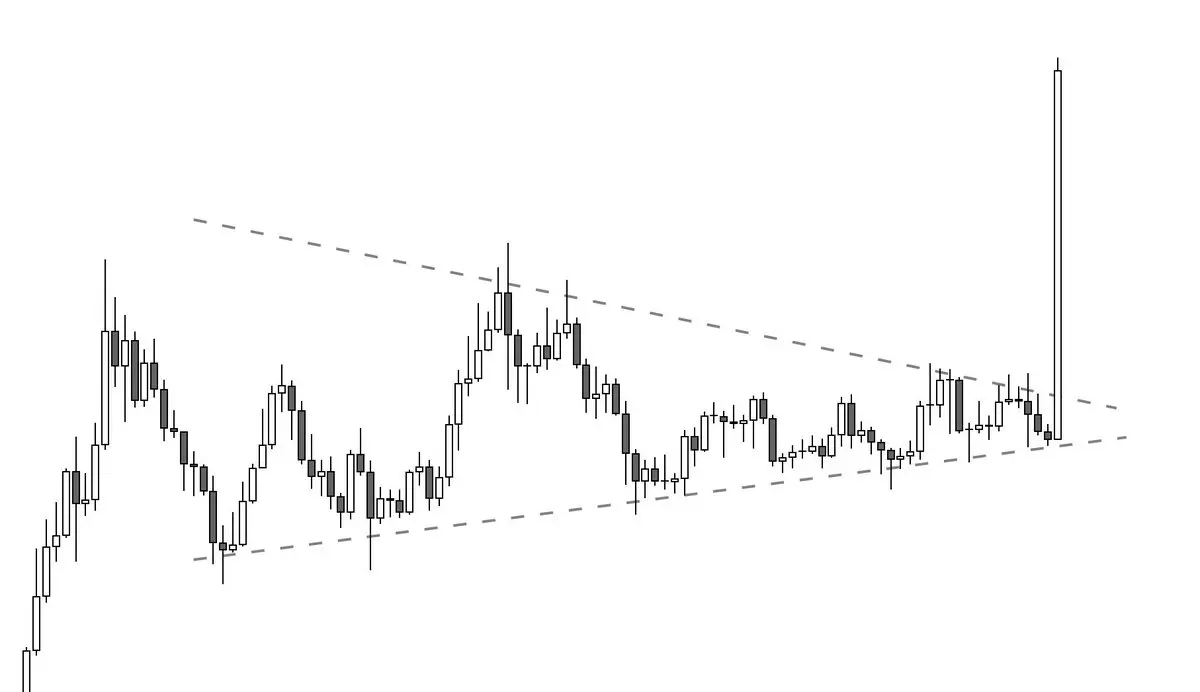
- Награда
- лайк
- комментарий
- Репост
- Поделиться
- Награда
- лайк
- комментарий
- Репост
- Поделиться
Золото достигает нового рекордного максимума justo как начинаются Золотые глобусы
Посмотреть Оригинал- Награда
- лайк
- комментарий
- Репост
- Поделиться
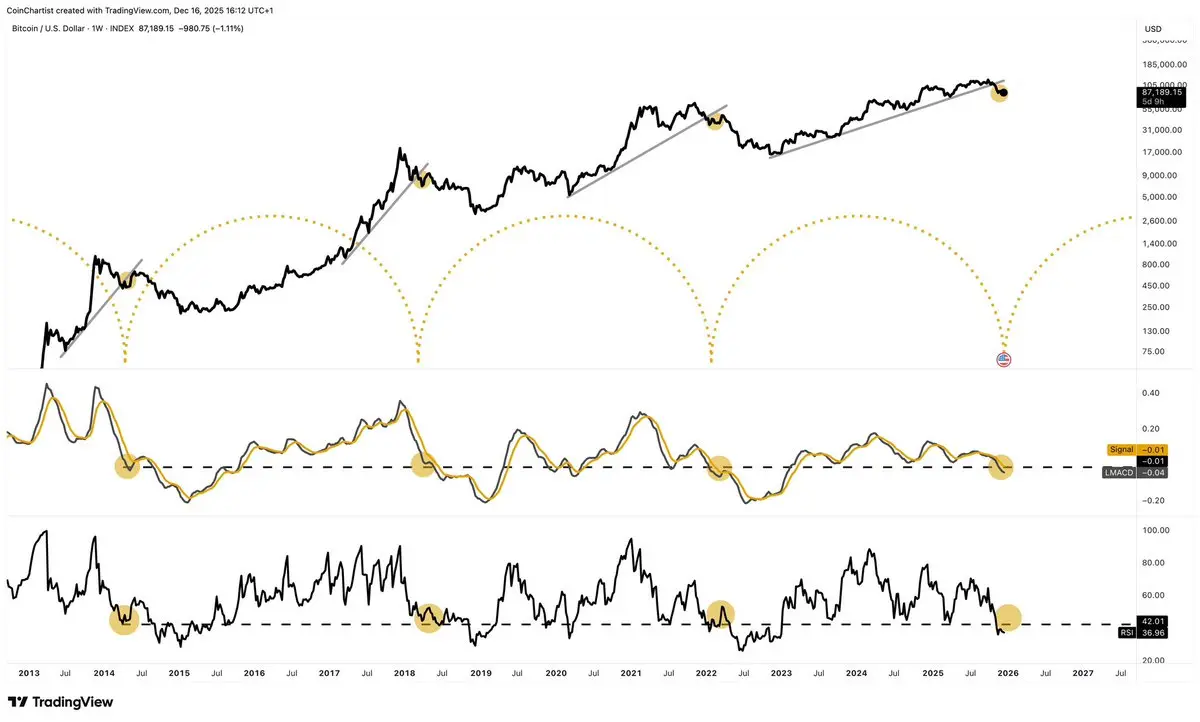
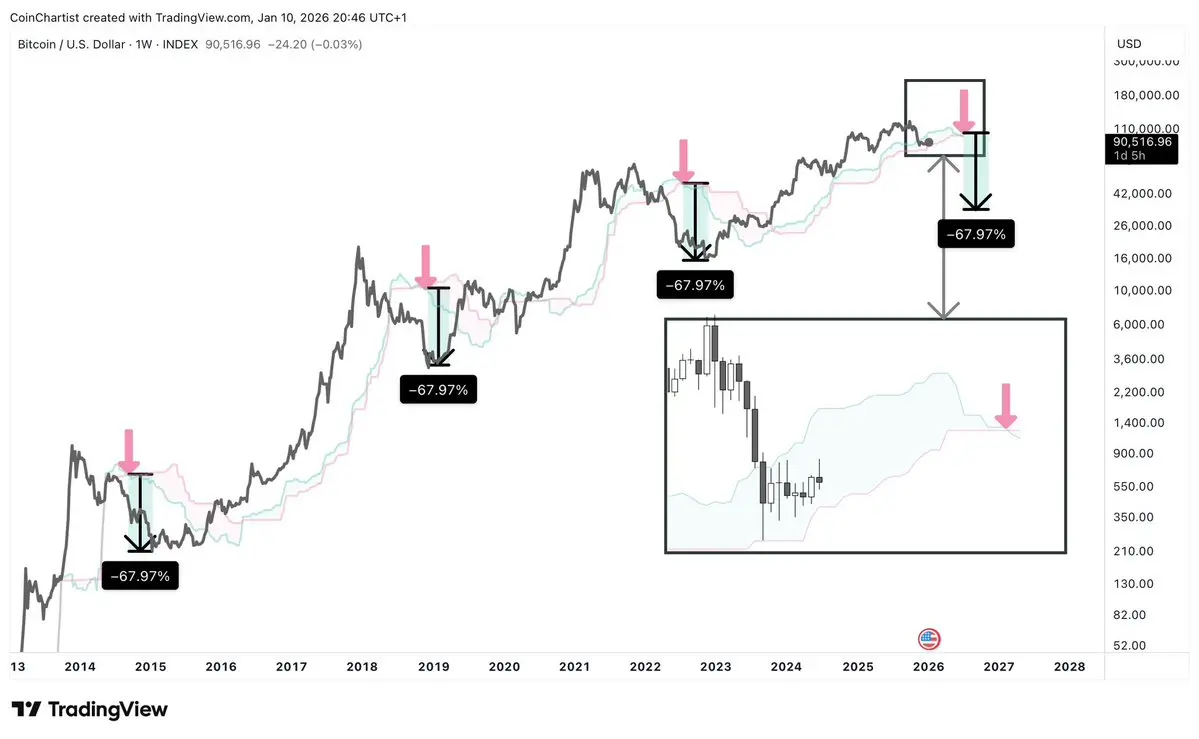
Еженедельный Kumo (облако) Bitcoin только что повернулось в красный цвет
Обычно дно у Bitcoin достигается ПОСЛЕ временного разворота медвежьего Kumo примерно на -68% ниже самого разворота
Ичимоку прогнозирует Kumo на 26 периодов вперед — это означает, что цена находится более чем в 150 днях от достижения времени разворота
Для этого, скорее всего, потребуется минимум около пяти месяцев, чтобы всё правильно развернулось. Целевая цена будет $33K если тот же -68% ниже разворота произойдет снова, что приведет к общему снижению рынка на 73%
Медвежьи рынки Bitcoin показывали постепенное сжатие снижен
BTC-0,35%
- Награда
- лайк
- комментарий
- Репост
- Поделиться
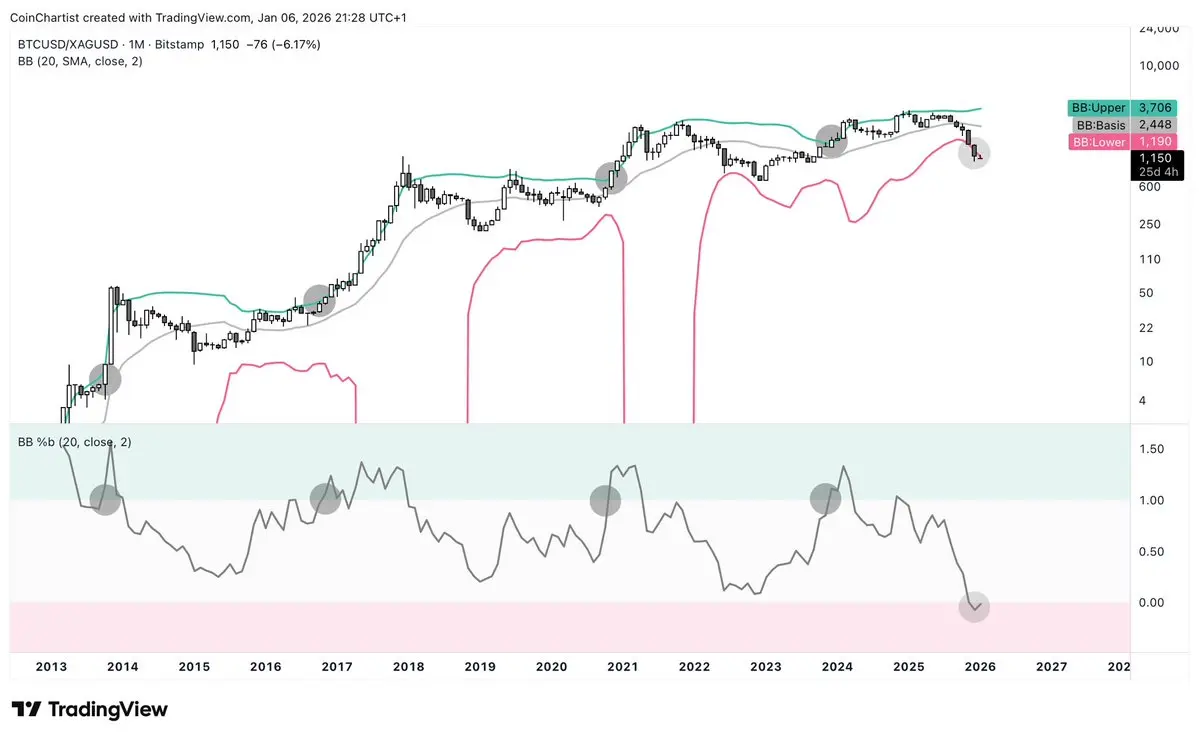
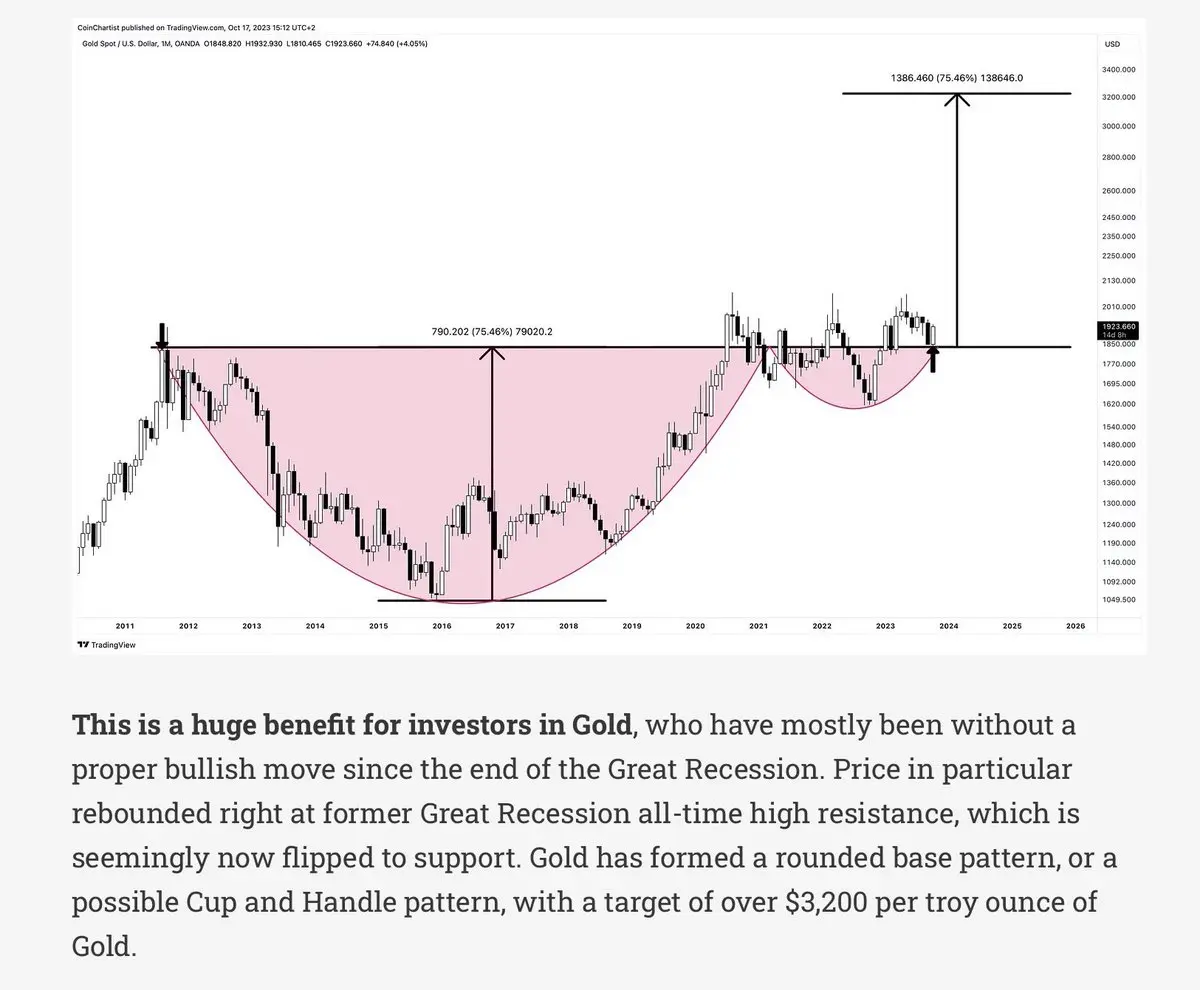
Октябрь 2023 «Полет к качеству»
$1923 & $22 / oz
Посмотреть Оригинал$1923 & $22 / oz

- Награда
- лайк
- комментарий
- Репост
- Поделиться
Та же средняя, другая среда
Посмотреть Оригинал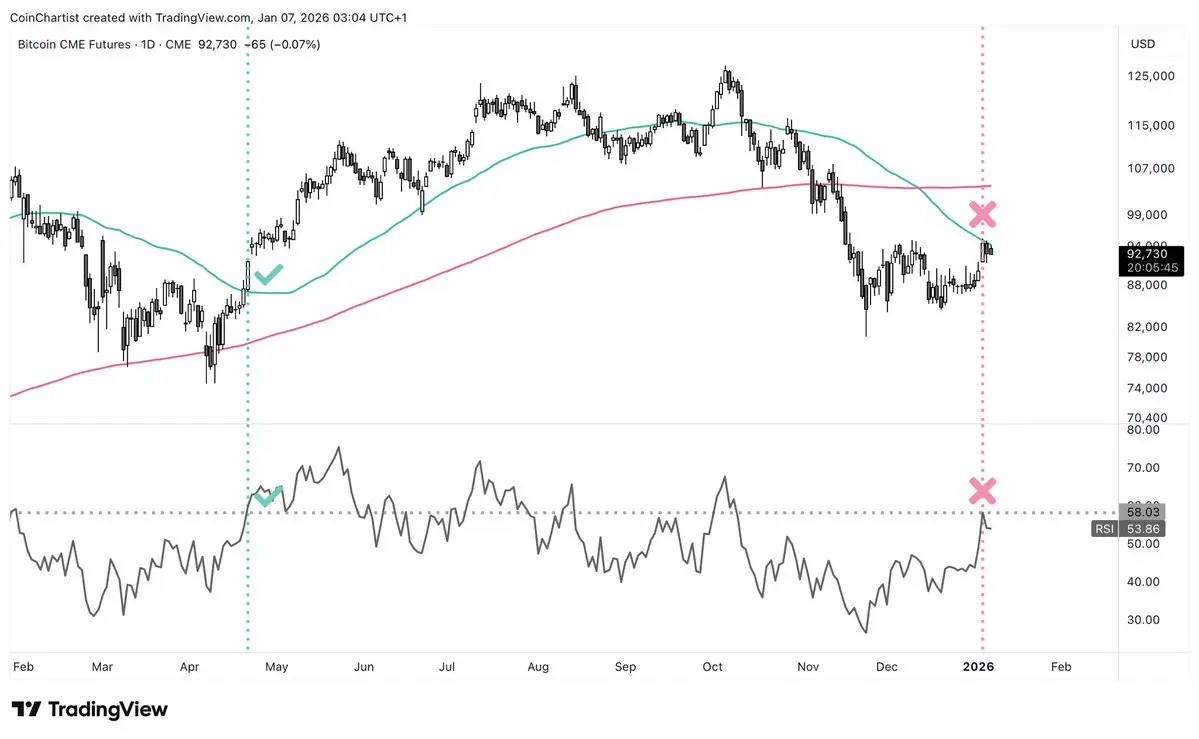
- Награда
- лайк
- комментарий
- Репост
- Поделиться
- Награда
- лайк
- комментарий
- Репост
- Поделиться
В последний раз, когда дневной RSI Bitcoin был таким высоким, цена превышала $120K, за несколько дней до резкого падения 10 октября
BTC-0,35%

- Награда
- лайк
- комментарий
- Репост
- Поделиться
Нет необходимости в техническом анализе, чтобы понять, куда движется повествование
Посмотреть Оригинал- Награда
- лайк
- комментарий
- Репост
- Поделиться
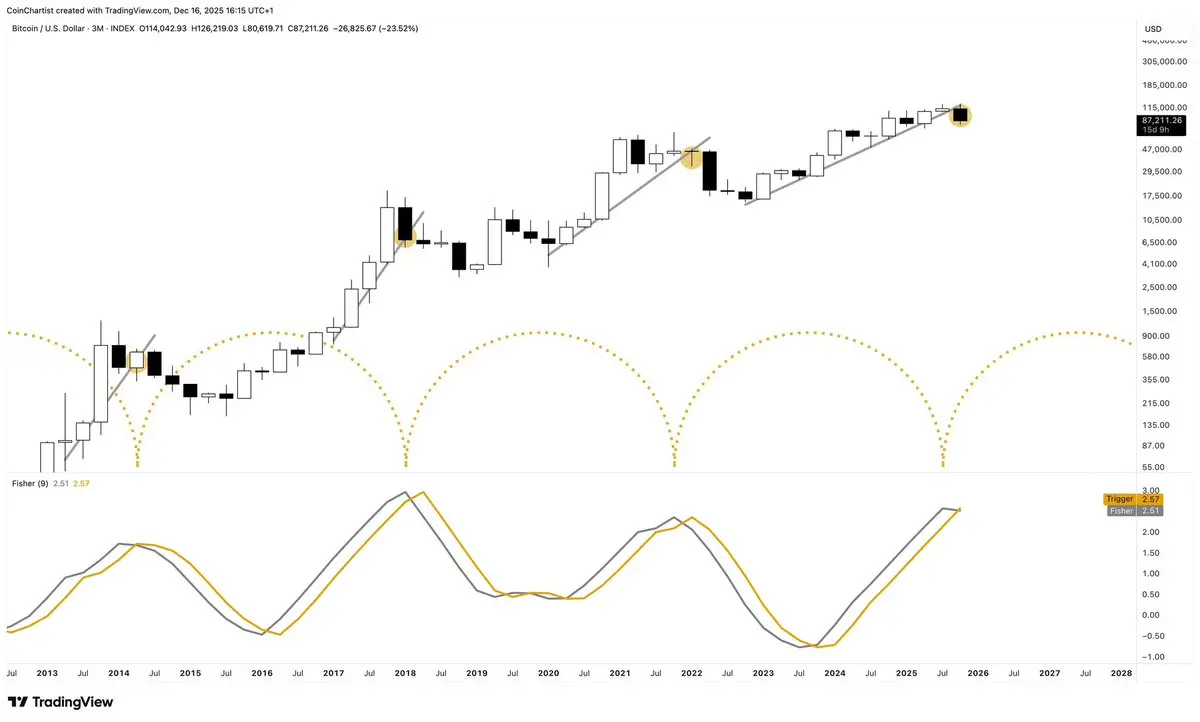
Надежда — это ловушка
Вера — это приманка
Посмотреть ОригиналВера — это приманка


- Награда
- лайк
- комментарий
- Репост
- Поделиться
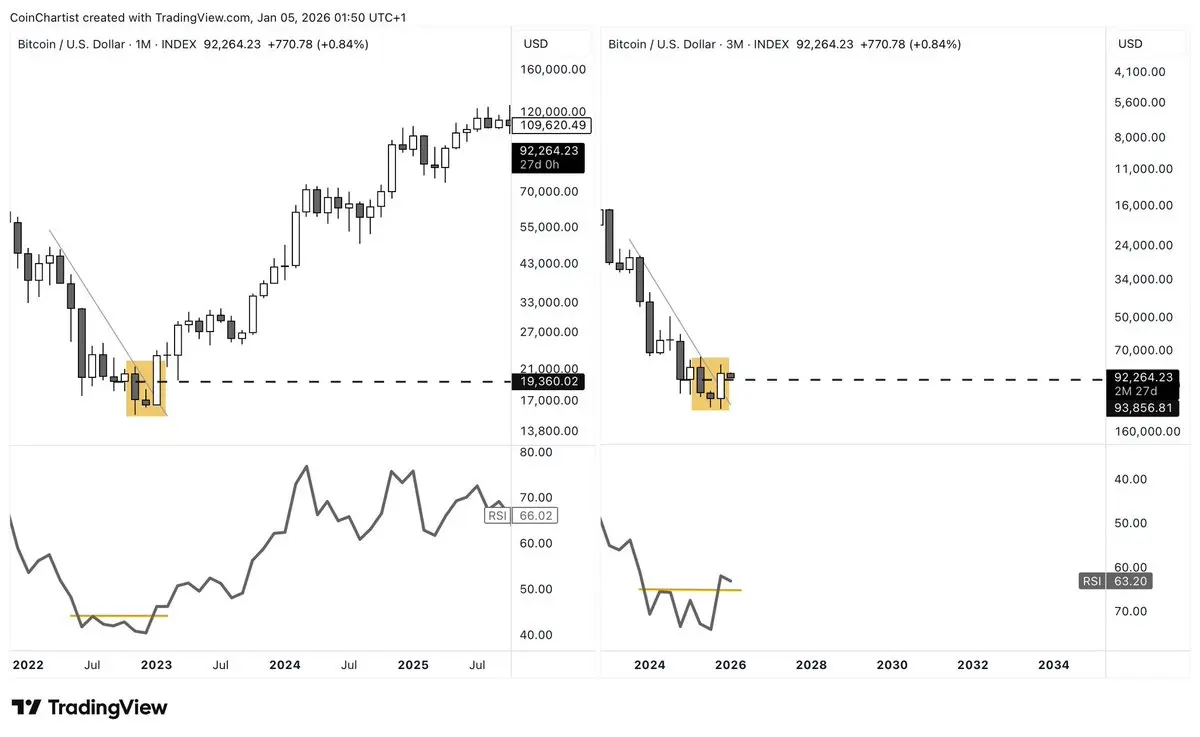
Левое: Дно Bitcoin 2022 года за 1M Morning Star и последующий бычий рынок
Правое: Обратная BTCUSD 3M Evening Star — что будет дальше?
Как этот взгляд и сравнение бросают вызов вашим существующим убеждениям?
Правое: Обратная BTCUSD 3M Evening Star — что будет дальше?
Как этот взгляд и сравнение бросают вызов вашим существующим убеждениям?
BTC-0,35%
- Награда
- 1
- 1
- Репост
- Поделиться
Unoshi :
:
Спасибо за информациюФибоначчи в музыке 🌀🎵
Большинство трейдеров знают о уровне коррекции Фибоначчи 0.618
Но вы знали, что музыканты часто используют этот ключевой коэффициент Фибоначчи в музыкальном производстве?
Это часто происходит, когда биты затихают, темп увеличивается или хук меняет поток песни настолько, чтобы повысить интерес
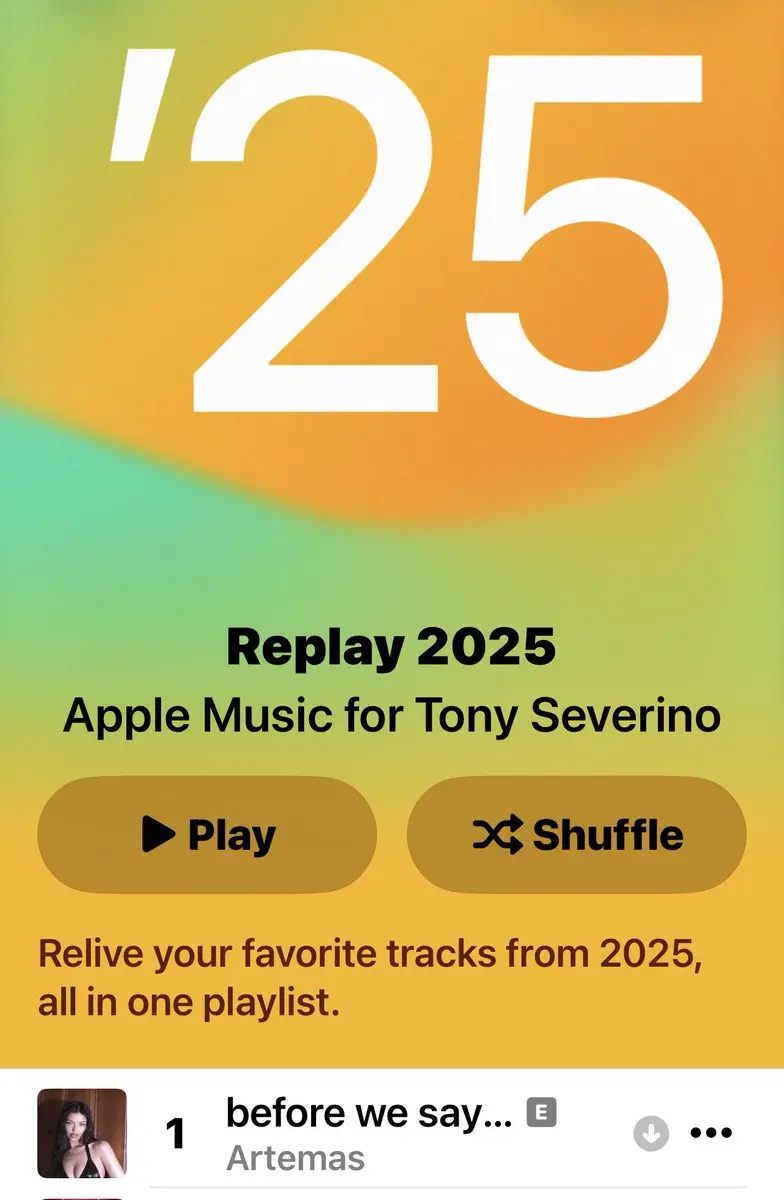
Мой лучший трек 2025 года — «Before We Say Goodbye» Артемаса — он содержит глубокие, тёмные, тяжёлые вибрации баса
Длина песни — 2 минуты и 27 секунд
Умножьте эту длину на 0.618, и получится 1 минута и 40 секунд
Если вы послушаете трек, по мере приближения к 1:40, бит затихает, нач
BTC-0,35%

- Награда
- лайк
- комментарий
- Репост
- Поделиться
Респект @apsk32
Единственный аналитик, которого я вижу, не действующий эмоционально
Я даже заметил выраженную озабоченность по поводу нарушения модели закона силы BTC/Gold
Искренний, спокойный, беспристрастный = это те аккаунты, которым можно доверять
Единственный аналитик, которого я вижу, не действующий эмоционально
Я даже заметил выраженную озабоченность по поводу нарушения модели закона силы BTC/Gold
Искренний, спокойный, беспристрастный = это те аккаунты, которым можно доверять
BTC-0,35%
- Награда
- лайк
- комментарий
- Репост
- Поделиться
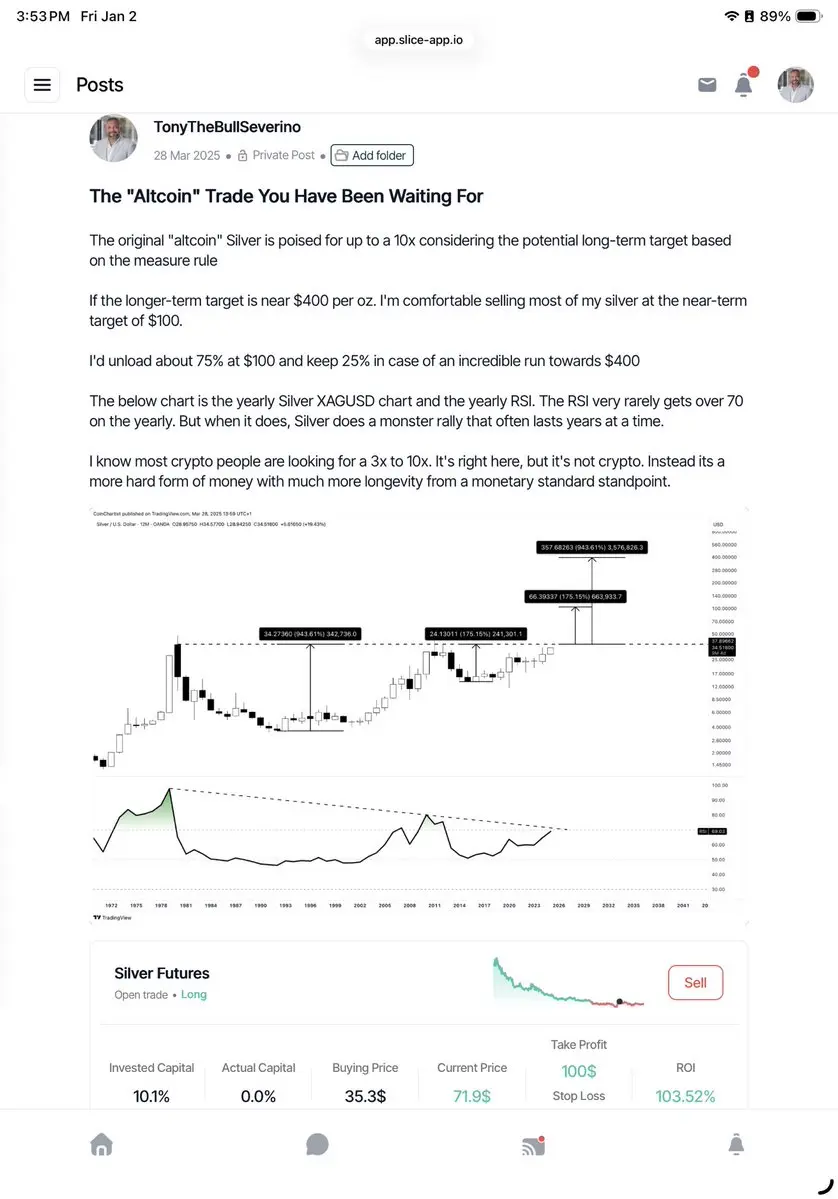
100% ROI для подписчиков Slice на *Silver* уровне на блюдечке
Ссылка в профиле
Ссылка в профиле
SLICE0,07%
- Награда
- лайк
- комментарий
- Репост
- Поделиться
