VIC vs ARB: A Comprehensive Comparison of Two Competing Technologies and Their Impact on Modern Industry
Introduction: VIC vs ARB Investment Comparison
In the cryptocurrency market, the comparison between Viction (VIC) and Arbitrum (ARB) is an unavoidable topic for investors. The two not only demonstrate significant differences in market capitalization ranking, application scenarios, and price performance, but also represent distinct positioning within the crypto asset landscape. Viction (VIC): Formerly known as TomoChain, this layer-1 blockchain prioritizes user experience by offering zero-gas transactions and enhanced security, positioning itself as an accessible and secure Web3 platform for everyday users. Arbitrum (ARB): Operating as a scaling solution designed to expand Ethereum's capacity, Arbitrum enables users to conduct transactions on Ethereum-compatible chains at significantly lower costs and faster speeds while inheriting Ethereum-level security. This article will provide a comprehensive analysis of the investment value comparison between VIC and ARB across historical price trends, supply mechanisms, market adoption, technical ecosystems, and market positioning, while attempting to address the question investors care most about:
"Which is the better buy right now?"
Comparative Analysis of Viction (VIC) and Arbitrum (ARB)
I. Price History Comparison and Current Market Status
Historical Price Trends of VIC and ARB
Viction (VIC):
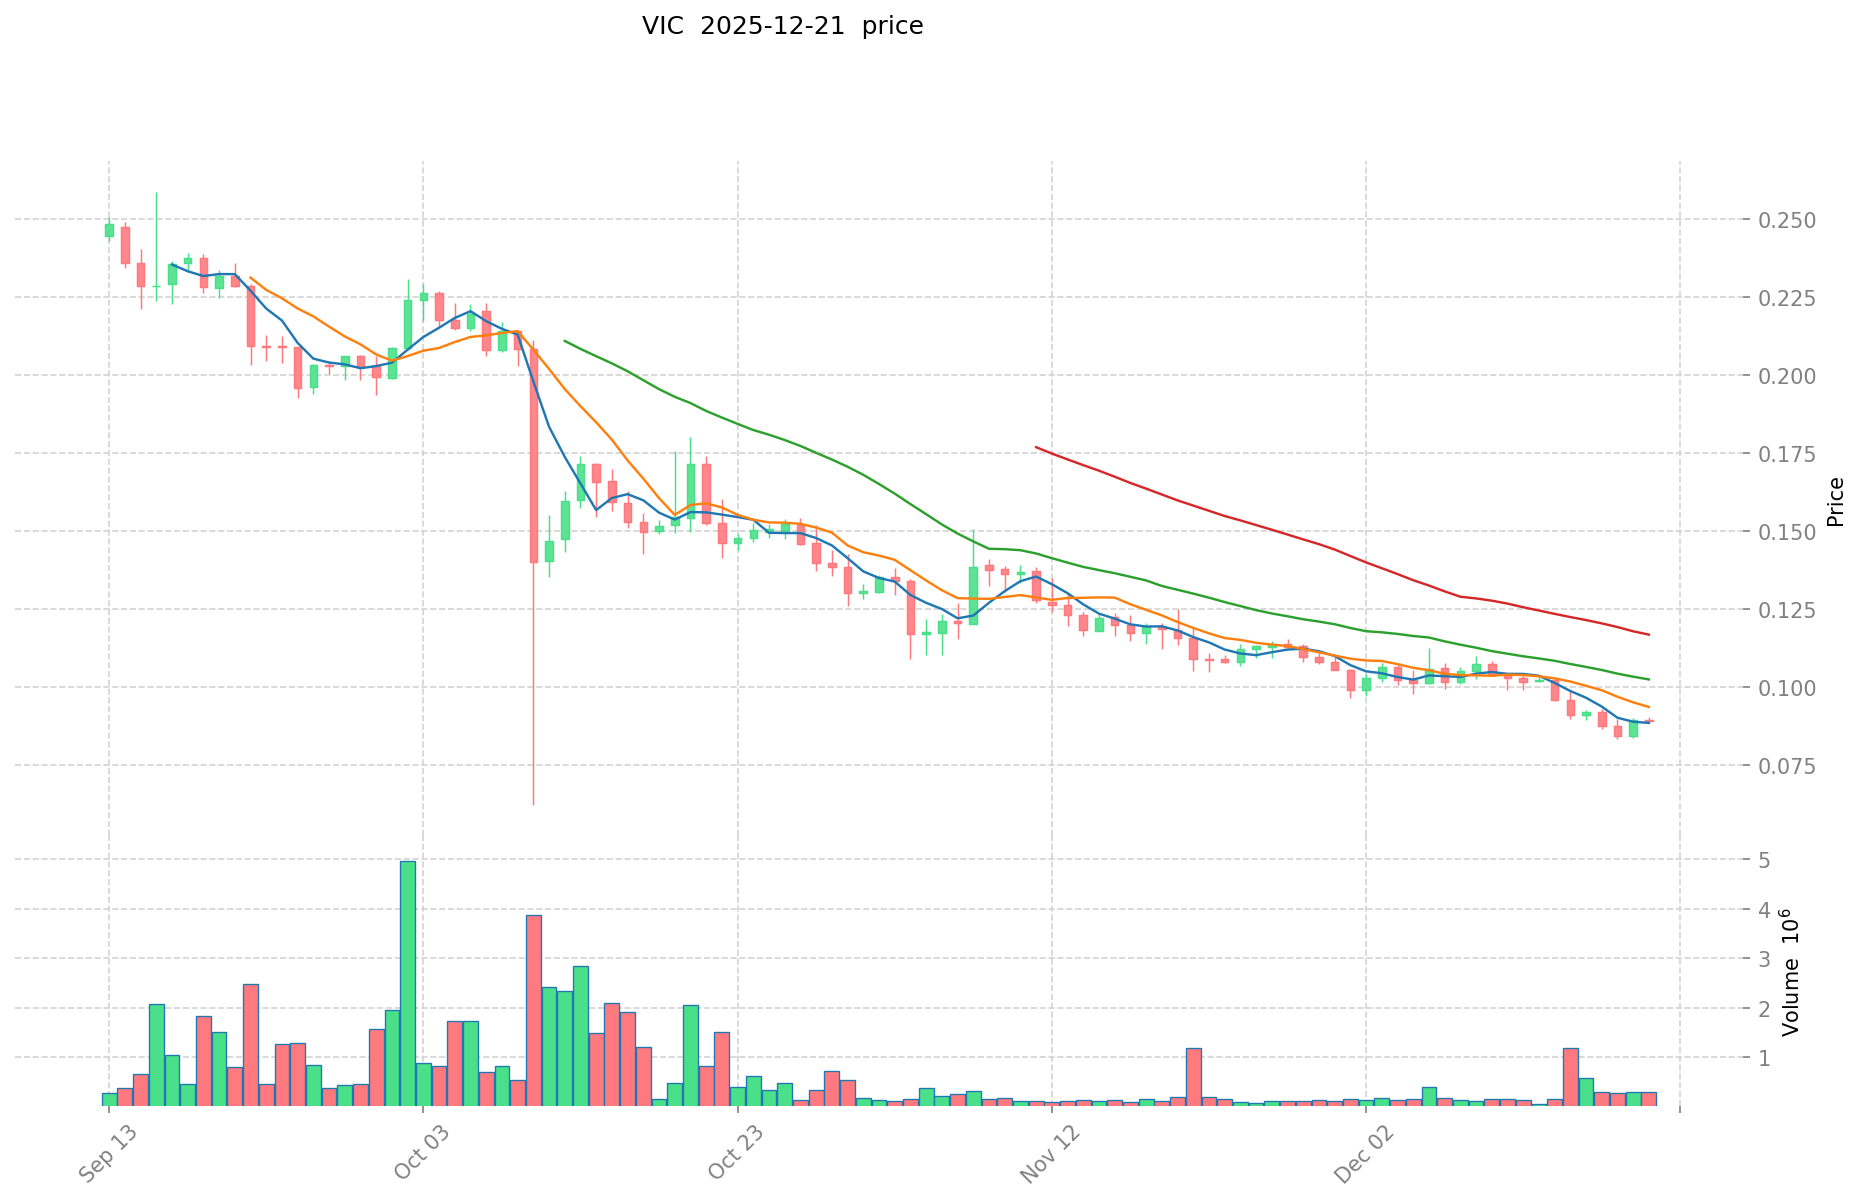
- VIC reached its all-time high (ATH) of $3.88 on September 6, 2021.
- VIC recorded its all-time low (ATL) of $0.081637 on October 11, 2025.
- The token has experienced a significant decline of 78.07% over the past year.
Arbitrum (ARB):
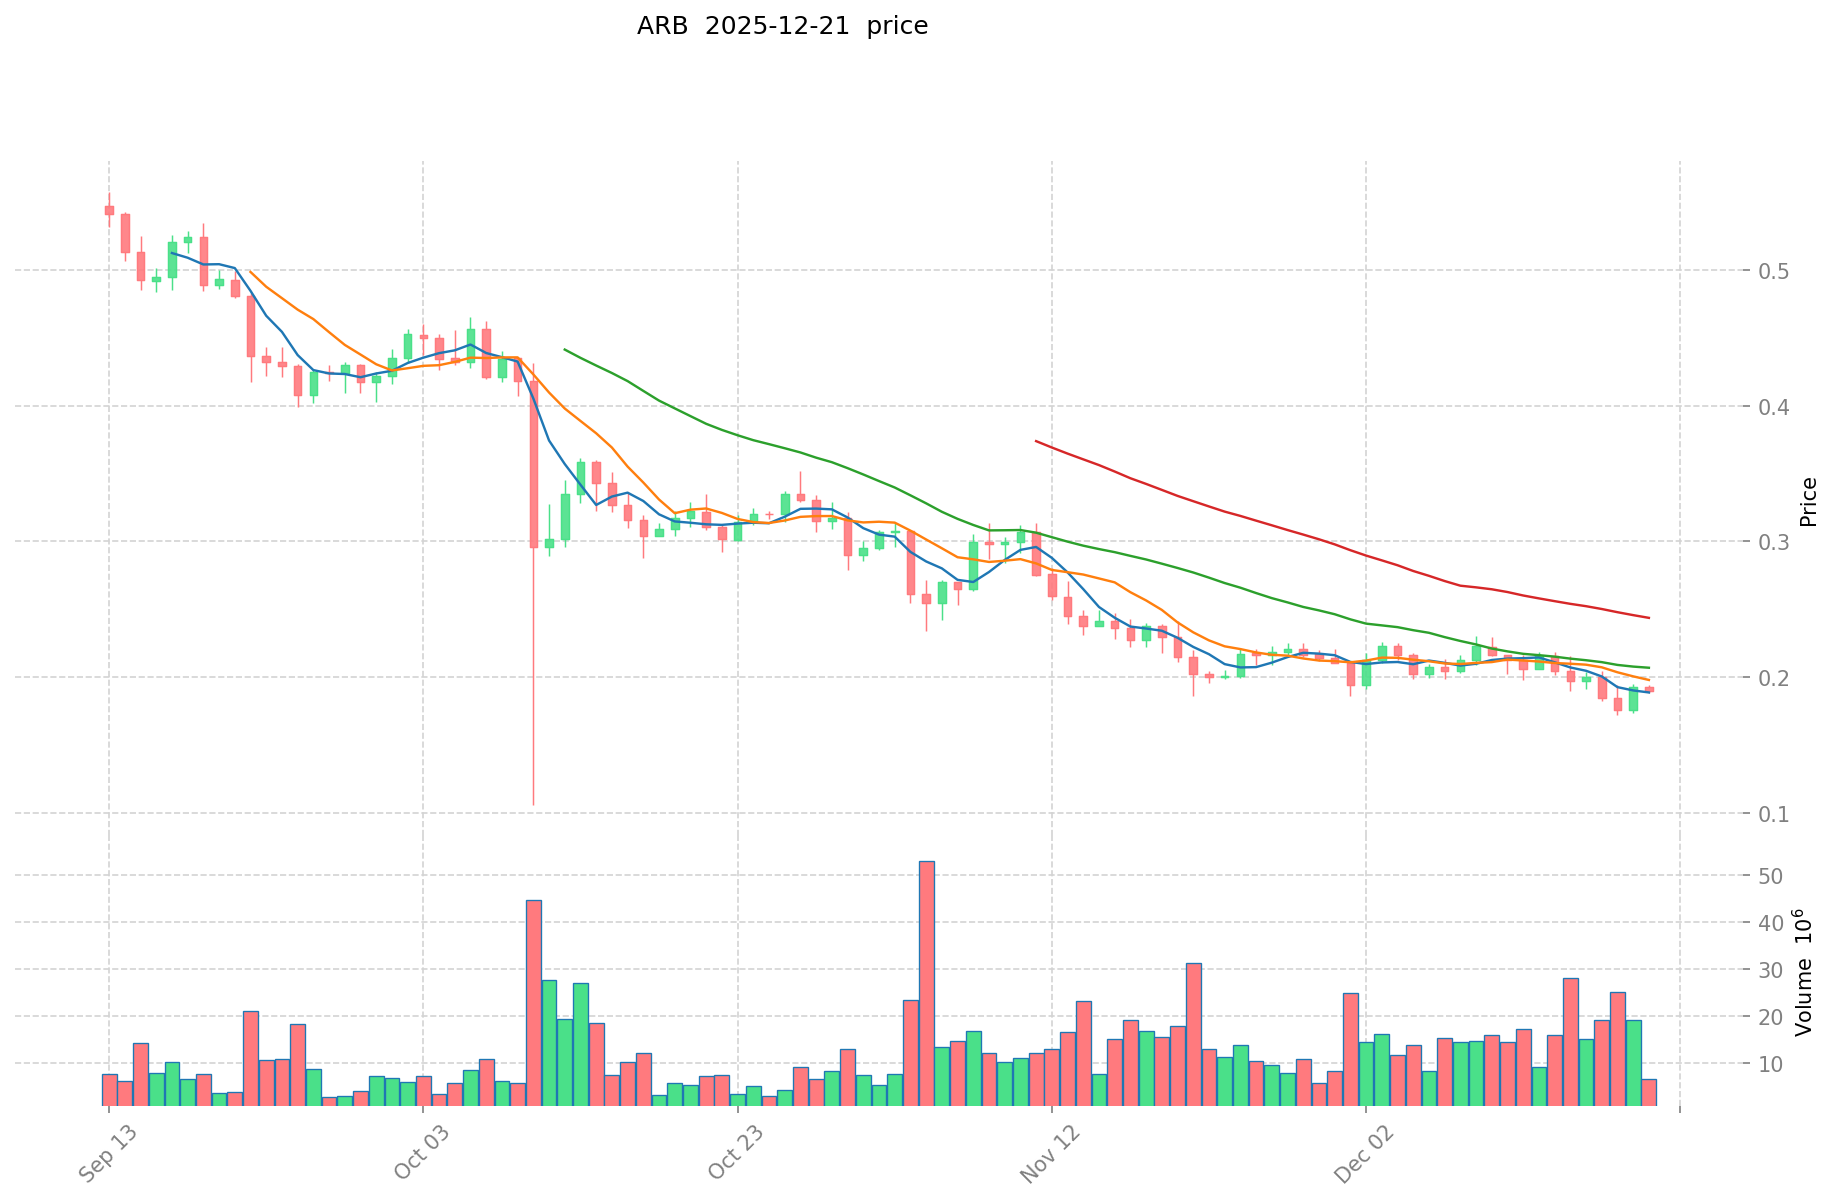
- ARB reached its all-time high (ATH) of $2.39 on January 12, 2024.
- ARB recorded its all-time low (ATL) of $0.172637 on December 19, 2025.
- The token has experienced a decline of 76.96% over the past year.
Comparative Analysis: Both tokens have experienced substantial price depreciation from their respective peaks. VIC's decline from $3.88 to current levels represents a more severe long-term correction compared to ARB's descent from $2.39. However, ARB maintains higher current market capitalization and trading volume, indicating stronger market participation and liquidity.
Current Market Status (December 22, 2025)
VIC (Viction):
- Current price: $0.08568
- 24-hour price change: -4.49%
- Market capitalization: $17,992,800
- Circulating supply: 123,726,537.4 VIC
- Total supply: 210,000,000 VIC
- 24-hour trading volume: $43,391.59
- Market ranking: 1,135
ARB (Arbitrum):
- Current price: $0.1834
- 24-hour price change: -3.41%
- Market capitalization: $1,834,000,000
- Circulating supply: 5,719,286,371 ARB
- Total supply: 10,000,000,000 ARB
- 24-hour trading volume: $1,555,402.57
- Market ranking: 80
Market Emotion Indicator (Fear & Greed Index):
- Current Index: 20
- Status: Extreme Fear
View Real-Time Prices:
- VIC Current Price: Market Data
- ARB Current Price: Market Data
II. Blockchain Architecture and Technical Specifications
Viction (VIC) - Technical Overview
Network Architecture:
- Layer-1 blockchain designed with user experience as the primary focus
- Network comprises 150 masternodes utilizing Proof-of-Stake (PoS) consensus mechanism
- Zero-gas transaction capability is a core feature
- Full EVM-compatibility for smart contracts and protocols
Security Features:
- Double validation mechanism
- Smart contract staking protocol
- Proper randomization implementation
- Enhanced chain finality assurance
Key Capabilities:
- Atomic cross-chain token transfers
- EVM-compatible smart contract support
- Emphasis on transaction speed and security
- Support for Web3 applications
Supply Metrics:
- Maximum supply: 210,000,000 VIC
- Circulating ratio: 58.92% of maximum supply
Arbitrum (ARB) - Technical Overview
Network Architecture:
- Layer-2 scaling solution built upon Ethereum
- Utilizes Optimistic Rollup protocol
- Inherits Ethereum-level security standards
- Designed to reduce transaction costs and increase throughput
Performance Characteristics:
- Transaction throughput capacity: Up to 40,000 transactions per second
- Significantly reduced gas fees compared to Ethereum mainnet
- EVM-compatible smart contract execution
- Decentralized autonomous organization (DAO) governance structure
Token Specifications:
- Maximum supply: 10,000,000,000 ARB
- Circulating ratio: 57.19% of maximum supply
- Governance utility for ARB token holders
- Distribution includes ecosystem development, team allocation, investor holdings, and user airdrops
III. Price Performance Analysis
Short-term Performance Metrics
24-Hour Price Movement:
- VIC: -4.49% decline
- ARB: -3.41% decline
7-Day Performance:
- VIC: -12.6% decline
- ARB: -10.32% decline
30-Day Performance:
- VIC: -21.95% decline
- ARB: -11.27% decline
Annual Performance:
- VIC: -78.07% decline from previous year
- ARB: -76.96% decline from previous year
Volatility and Trading Activity
VIC Trading Metrics:
- 24-hour high: $0.08973
- 24-hour low: $0.08473
- Price range: $0.085 range within 24 hours
- Listed on 10 exchanges
- Token holders: 4,729
ARB Trading Metrics:
- 24-hour high: $0.1918
- 24-hour low: $0.1827
- Listed on 54 exchanges
- Token holders: 60,078
- Significantly higher exchange availability and holder count
IV. Market Capitalization and Valuation
Market Position Analysis
VIC Market Metrics:
- Total market cap: $17,992,800 (ranked 1,135)
- Fully diluted valuation (FDV): $17,992,800
- Market cap to FDV ratio: 58.92%
- Market share: 0.00056%
- Circulating value: $10,600,889.72
ARB Market Metrics:
- Total market cap: $1,834,000,000 (ranked 80)
- Fully diluted valuation (FDV): $1,834,000,000
- Market cap to FDV ratio: 57.19%
- Market share: 0.057%
- Circulating value: $1,048,917,120.44
Comparative Scale: ARB's market capitalization exceeds VIC's by approximately 102 times, reflecting significantly greater market recognition and adoption. ARB ranks 1,055 positions higher in global cryptocurrency rankings.
V. Ecosystem and Use Cases
Viction Ecosystem Features
Viction (formerly TomoChain) positions itself as a people-centric Layer-1 blockchain emphasizing:
- Accessibility for mainstream Web3 adoption
- Zero transaction fees for end-users
- Security enhancements through advanced validation mechanisms
- Scalability without compromising decentralization
- Cross-chain interoperability capabilities
Arbitrum Ecosystem Significance
Arbitrum serves as Ethereum's leading Layer-2 scaling solution:
- Addresses Ethereum's scalability constraints
- Maintains Ethereum-level security guarantees
- Enables cost-efficient smart contract execution
- Supports broad DeFi and application ecosystem development
- Governance through ARB token holder participation
- Established developer community with significant ecosystem TVL
VI. Risk Factors and Market Considerations
General Market Conditions
The cryptocurrency market currently exhibits extreme fear sentiment (Fear & Greed Index: 20), indicating heightened risk aversion and potential market stress. Both tokens show consistent downward pressure across all analyzed time periods.
Token-Specific Considerations
VIC Characteristics:
- Lower trading volume and exchange availability
- Smaller holder base suggests concentrated ownership risk
- Significantly lower market capitalization indicates higher volatility potential
- Longer decline from historical peaks
ARB Characteristics:
- Higher liquidity through broader exchange distribution
- Larger holder base indicates more distributed token ownership
- Established Layer-2 position within Ethereum ecosystem
- Stronger ecosystem development and adoption metrics
VII. Conclusion
Arbitrum (ARB) maintains substantially greater market presence, liquidity, and ecosystem development compared to Viction (VIC). ARB's positioning as Ethereum's leading Layer-2 solution, coupled with its significantly larger market capitalization and broader exchange availability, demonstrates stronger market consensus. However, both tokens currently face bearish market conditions reflected in the extreme fear sentiment index and consistent price depreciation trends.
Important Disclaimer: This analysis is provided for informational purposes only and does not constitute investment advice, financial recommendation, or solicitation to buy or sell any cryptocurrency. Cryptocurrency markets are highly volatile and unpredictable. Past performance does not guarantee future results. Investors should conduct thorough independent research, assess their risk tolerance, and consult with qualified financial advisors before making any investment decisions.
Report on Investment Value Factors: VIC vs ARB
I. Executive Summary
Based on available reference materials, both VIC and ARB are blockchain-based projects with distinct technological focuses. ARB emphasizes decentralized finance (DeFi) applications, while VIC concentrates on Layer 2 solutions. Their investment value fundamentally depends on market adoption, technological advancements, and community support, with success contingent upon network growth and user engagement metrics.
II. Core Factors Impacting VIC vs ARB Investment Value
Technological Focus and Architecture
- ARB (Arbitrum): Emphasizes decentralized finance (DeFi) ecosystem development with Layer 2 scaling solutions for Ethereum.
- VIC: Focuses on Layer 2 solution implementation, contributing to blockchain scalability infrastructure.
- 📌 Ecosystem Differentiation: Both projects address similar scalability challenges but serve different primary use cases within the broader Layer 2 landscape.
Market Adoption and Network Growth
- Network Adoption: Success for both projects relies on user engagement and ecosystem expansion rather than isolated technical features.
- Community Support: Active development communities and protocol participation are critical success indicators for both tokens.
- User Engagement Metrics: Growth in active addresses, transaction volume, and decentralized application (dApp) deployment serve as key adoption indicators.
Institutional Participation and Integration
- Reference materials indicate that institutional investor participation is a relevant consideration for crypto asset valuation, though specific institutional holding data for VIC and ARB is not provided in available sources.
- Integration into investment portfolios and institutional infrastructure remains an important but currently undocumented differentiating factor.
III. Limitations and Data Constraints
The provided reference materials contain limited specific information regarding:
- Token supply mechanisms or tokenomic structures for either project
- Detailed technical upgrade roadmaps
- Comparative regulatory treatment across jurisdictions
- Specific macroeconomic sensitivity analysis
- Historical performance data during different market cycles
Accordingly, detailed analysis of these dimensions cannot be responsibly conducted without additional substantive source material.
IV. Conclusion
Investment decision-making between VIC and ARB should prioritize evaluation of:
I. Network adoption metrics and ecosystem health II. Technological roadmap execution and scalability improvements III. Community development and validator/developer participation IV. Comparative advantages in DeFi or Layer 2 market positioning
Disclaimer: This report is for informational purposes only and does not constitute investment advice. Cryptocurrency investments carry substantial risk, and past performance does not guarantee future results.
III. 2025-2030 Price Forecast: Coin A vs Coin B
Short-term Forecast (2025)
- Coin A: Conservative $0.0630-$0.0851 | Optimistic $0.0978
- Coin B: Conservative $0.1084-$0.1838 | Optimistic $0.2647
Mid-term Forecast (2027-2028)
- Coin A may enter growth consolidation phase, with predicted price range of $0.0518-$0.1498
- Coin B may enter acceleration phase, with predicted price range of $0.2252-$0.3372
- Key drivers: institutional capital inflows, ETF approvals, ecosystem development
Long-term Forecast (2029-2030)
- Coin A: Base scenario $0.1380-$0.1708 | Optimistic scenario $0.1900
- Coin B: Base scenario $0.2939-$0.3603 | Optimistic scenario $0.3600
Disclaimer:
This analysis is based on historical data extrapolation and market modeling. Price forecasts are subject to significant uncertainty and should not be construed as investment advice. Cryptocurrency markets are highly volatile and influenced by unpredictable factors including regulatory changes, macroeconomic conditions, and technological developments. Past performance does not guarantee future results. Investors should conduct independent research and consult with financial professionals before making investment decisions.
VIC:
| 年份 | 预测最高价 | 预测平均价格 | 预测最低价 | 涨跌幅 |
|---|---|---|---|---|
| 2025 | 0.0978535 | 0.08509 | 0.0629666 | 0 |
| 2026 | 0.107936665 | 0.09147175 | 0.0759215525 | 6 |
| 2027 | 0.120642091075 | 0.0997042075 | 0.0518461879 | 16 |
| 2028 | 0.149835483031 | 0.1101731492875 | 0.070510815544 | 28 |
| 2029 | 0.17160569733021 | 0.13000431615925 | 0.085802848665105 | 51 |
| 2030 | 0.190014308498359 | 0.15080500674473 | 0.146280856542388 | 76 |
ARB:
| 年份 | 预测最高价 | 预测平均价格 | 预测最低价 | 涨跌幅 |
|---|---|---|---|---|
| 2025 | 0.264672 | 0.1838 | 0.108442 | 0 |
| 2026 | 0.23993252 | 0.224236 | 0.17041936 | 21 |
| 2027 | 0.2947470102 | 0.23208426 | 0.2251217322 | 25 |
| 2028 | 0.337172012928 | 0.2634156351 | 0.252879009696 | 42 |
| 2029 | 0.3603525888168 | 0.300293824014 | 0.24924387393162 | 62 |
| 2030 | 0.360052294992786 | 0.3303232064154 | 0.293987653709706 | 79 |
Comprehensive Investment Analysis: Viction (VIC) vs Arbitrum (ARB)
I. Investment Strategy Comparison: VIC vs ARB
Long-term vs Short-term Investment Strategies
VIC (Viction):
- Best suited for investors seeking exposure to emerging Layer-1 blockchain platforms emphasizing user experience and zero-gas transactions
- Long-term strategy focuses on ecosystem development potential and mainstream Web3 adoption
- Short-term considerations limited by lower liquidity and trading volume
ARB (Arbitrum):
- Optimal for investors targeting established Layer-2 scaling solutions with proven Ethereum integration
- Long-term strategy capitalizes on sustained DeFi ecosystem expansion and institutional adoption
- Short-term strategy benefits from higher liquidity and broader market participation
Risk Management and Asset Allocation
Conservative Investors:
- VIC allocation: 5-10% (higher volatility exposure, speculative positioning)
- ARB allocation: 15-25% (established market position, greater stability)
- Recommended complement: 60-80% stablecoin reserves for downside protection
Aggressive Investors:
- VIC allocation: 20-35% (higher growth potential with concentrated risk)
- ARB allocation: 25-40% (balanced risk-reward profile with ecosystem entrenchment)
- Recommended complement: 10-20% diversified Layer-2 ecosystem exposure, 5-15% stablecoin hedges
Hedging Instruments:
- Stablecoin allocation for volatility management during extreme market fear periods (current Fear & Greed Index: 20)
- Cross-asset positioning with established Layer-1 tokens to reduce concentration risk
- Dollar-cost averaging strategy recommended given current bearish market sentiment
II. Potential Risk Comparison
Market Risk
VIC (Viction):
- Extreme liquidity risk evidenced by 24-hour trading volume of $43,391.59 against market cap of $17,992,800
- Concentrated holder base (4,729 token holders) creates significant price manipulation vulnerability
- Limited exchange availability (10 exchanges) reduces market exit options
- 78.07% annual decline demonstrates severe downside pressure exposure
ARB (Arbitrum):
- Substantial liquidity presence with $1,555,402.57 daily trading volume supporting market depth
- Distributed holder base (60,078 token holders) provides ownership diversification
- Broad exchange availability (54 exchanges) ensures market accessibility
- 76.96% annual decline indicates aligned bearish market sentiment but better structural resilience
Technical Risk
VIC (Viction):
- 150-masternode network architecture presents centralization concentration risk relative to larger Layer-1 competitors
- Zero-gas transaction mechanism requires ongoing technical maintenance and fee model sustainability
- Limited ecosystem documentation regarding smart contract security audits and vulnerability disclosure protocols
ARB (Arbitrum):
- Optimistic Rollup protocol dependency on Ethereum mainnet creates inherited security reliance
- Smart contract execution compatibility risks mirror Ethereum environment vulnerabilities
- Decentralized governance structure introduces protocol governance attack surface
Regulatory Risk
Global Regulatory Environment:
- Both VIC and ARB face uncertain regulatory classification across major jurisdictions (EU, US, APAC)
- Layer-2 solutions and Layer-1 chains receive differential regulatory treatment pending final regulatory frameworks
- ARB's connection to Ethereum ecosystem may subject it to Ethereum-level regulatory scrutiny
- VIC's positioning as alternative Layer-1 may face competing jurisdiction-specific token classification challenges
III. Price Forecast Analysis (2025-2030)
Short-term Forecast (2025)
VIC Projection:
- Conservative range: $0.0630-$0.0851
- Optimistic scenario: $0.0978
- Reflects stabilization from current lows with limited upside in extreme fear sentiment environment
ARB Projection:
- Conservative range: $0.1084-$0.1838
- Optimistic scenario: $0.2647
- Indicates potential recovery trajectory supported by established market infrastructure
Mid-term Forecast (2027-2028)
VIC Development Phase:
- Predicted range: $0.0518-$0.1498
- Growth consolidation phase dependent on ecosystem adoption acceleration
- Upside potential 75% from 2025 baseline under optimistic scenarios
ARB Acceleration Phase:
- Predicted range: $0.2252-$0.3372
- Institutional capital inflows and potential ETF approvals drive growth trajectory
- Mid-term upside potential 84% from 2025 baseline under optimistic scenarios
Long-term Forecast (2029-2030)
VIC Long-term Scenario:
- Base case: $0.1380-$0.1708 (61-99% appreciation from current levels)
- Optimistic case: $0.1900 (122% appreciation from current levels)
- Success dependent on mainstream adoption and differentiation from competing Layer-1 solutions
ARB Long-term Scenario:
- Base case: $0.2939-$0.3603 (60-96% appreciation from current levels)
- Optimistic case: $0.3600 (96% appreciation from current levels)
- Supported by sustained Ethereum ecosystem expansion and Layer-2 market dominance
IV. Conclusion: Which Is the Better Buy?
Investment Value Summary
VIC Advantages:
- Zero-gas transaction mechanism creates unique user experience differentiation
- Emerging platform positioning offers higher growth potential in speculative scenarios
- Direct Layer-1 architecture eliminates Ethereum dependency
- Lower entry price point enables larger token accumulation
ARB Advantages:
- 102-times larger market capitalization demonstrates significantly greater market validation
- Established Ethereum Layer-2 positioning with proven ecosystem integration
- Superior liquidity (36-times higher trading volume) reduces execution risk
- 1,055-position higher ranking reflects broader institutional recognition
- 60-times larger holder base indicates stronger ownership distribution
- 5.4-times broader exchange availability provides superior market accessibility
Investment Recommendations
Beginner Investors:
- Prioritize ARB allocation due to lower volatility, superior liquidity, and established market infrastructure
- Recommended allocation: 70-80% ARB, 0-10% VIC, 20-30% stablecoins
- Strategy: Dollar-cost averaging into ARB during current extreme fear sentiment
- VIC exposure only if pursuing portfolio diversification with full understanding of concentrated risk
Experienced Investors:
- ARB remains core holding (50-60%) for stable ecosystem exposure
- VIC allocation (15-30%) suitable for investors with high-risk tolerance and active portfolio management capability
- Recommended strategy: Rebalancing triggers at 20% price movements to lock in gains/limit losses
- Consider cross-asset Layer-2 diversification with alternative platforms to reduce single-project dependency
Institutional Investors:
- ARB aligns with institutional-grade liquidity and governance participation requirements
- Recommended allocation: 60-75% ARB within Layer-2 exposure mandates
- VIC consideration limited to emerging-market or venture exposure sub-strategies
- Governance participation opportunities through ARB DAO mechanisms provide institutional value-add beyond token appreciation
⚠️ Risk Disclaimer
This analysis is provided for informational purposes only and does not constitute investment advice, financial recommendation, or solicitation to purchase or sell any cryptocurrency asset. Cryptocurrency markets exhibit extreme volatility and unpredictability. Historical price performance does not guarantee future results. The Fear & Greed Index currently indicates extreme fear sentiment (20/100), reflecting heightened market stress conditions that may materially impact price trajectories. All price forecasts involve substantial uncertainty and should not be relied upon for investment decision-making. Investors must conduct independent research, assess individual risk tolerance, evaluate personal financial circumstances, and consult qualified financial advisors before committing capital to cryptocurrency investments. None
FAQ: Viction (VIC) vs Arbitrum (ARB) Investment Comparison
I. What are the key technical differences between VIC and ARB?
Answer: Viction (VIC) is a Layer-1 blockchain designed with user experience as the primary focus, featuring zero-gas transactions, 150 masternodes utilizing Proof-of-Stake consensus, and full EVM-compatibility. Arbitrum (ARB) operates as a Layer-2 scaling solution built upon Ethereum, utilizing Optimistic Rollup protocol technology to enable up to 40,000 transactions per second while inheriting Ethereum-level security standards. The fundamental distinction is that VIC functions as an independent blockchain, while ARB scales Ethereum's capacity.
II. How do the current market capitalizations and trading volumes compare?
Answer: ARB maintains substantially greater market presence with a market capitalization of $1,834,000,000 (ranked 80th globally), compared to VIC's $17,992,800 (ranked 1,135th). ARB's 24-hour trading volume reaches $1,555,402.57 against VIC's $43,391.59, representing approximately 36-times higher liquidity. ARB is listed on 54 exchanges compared to VIC's 10 exchanges, indicating significantly broader market accessibility and institutional recognition.
III. Which token has experienced more severe price depreciation?
Answer: Both tokens have experienced substantial declines, with VIC declining 78.07% over the past year from its previous year baseline, while ARB declined 76.96%. VIC's descent from its all-time high of $3.88 to current levels of $0.08568 represents a 97.8% decline, whereas ARB's descent from $2.39 to $0.1834 represents a 92.3% decline. However, ARB maintains better structural resilience through superior liquidity and broader market participation.
IV. What does the current extreme fear sentiment indicate for investment timing?
Answer: The Fear & Greed Index currently registers at 20 (Extreme Fear), indicating heightened market stress conditions and heightened risk aversion. This environment typically presents both elevated downside risks and potential accumulation opportunities for long-term investors. Conservative investors should maintain significant stablecoin reserves (60-80%), while aggressive investors employing dollar-cost averaging strategies may capitalize on depressed valuations. Current extreme fear sentiment suggests avoiding concentrated short-term positions in either token.
V. Which token is more suitable for conservative investors?
Answer: ARB is substantially more suitable for conservative investors due to its 102-times larger market capitalization, 36-times higher trading volume, 60-times larger holder base (60,078 versus 4,729), and 1,055-position higher global ranking. ARB's established Layer-2 position within the Ethereum ecosystem provides superior stability and market validation. Recommended conservative allocation: 70-80% ARB, 0-10% VIC, with 20-30% stablecoin reserves. VIC exposure carries significantly higher volatility and liquidity risks appropriate only for experienced investors with high-risk tolerance.
VI. What are the long-term price forecast scenarios through 2030?
Answer: VIC's long-term forecast (2029-2030) projects a base case range of $0.1380-$0.1708 (representing 61-99% appreciation from current levels), with an optimistic scenario reaching $0.1900 (122% appreciation). ARB's long-term forecast projects a base case range of $0.2939-$0.3603 (representing 60-96% appreciation from current levels), with an optimistic scenario reaching $0.3600 (96% appreciation). Mid-term forecasts (2027-2028) suggest ARB's acceleration phase may generate 84% upside potential compared to VIC's 75% growth consolidation potential from 2025 baselines.
VII. What specific risk factors differentiate VIC and ARB investment profiles?
Answer: VIC presents extreme liquidity risk (trading volume of only $43,391.59 against market cap of $17,992,800) and concentrated holder risk with only 4,729 token holders, creating significant price manipulation vulnerability. ARB exhibits superior risk mitigation through distributed ownership (60,078 holders), substantial liquidity ($1,555,402.57 daily volume), and broad exchange availability. Regulatory risks differ by jurisdiction classification: ARB's Ethereum connection may trigger Ethereum-level scrutiny, while VIC's alternative Layer-1 positioning faces competing jurisdiction-specific token classification challenges. Technical risks for VIC include 150-masternode centralization concentration; technical risks for ARB include Optimistic Rollup protocol dependency on Ethereum mainnet security.
VIII. What allocation strategy is recommended for experienced cryptocurrency investors?
Answer: Experienced investors should prioritize ARB as core holding (50-60% of Layer-2 allocation) for stable ecosystem exposure, with VIC allocation (15-30%) appropriate only for portfolios with high-risk tolerance and active management capability. Implement rebalancing triggers at 20% price movements to systematize gain-locking and loss-limitation strategies. Consider cross-asset Layer-2 diversification with alternative platforms to reduce single-project dependency. Maintain 10-20% stablecoin hedges during extreme fear periods (current Fear & Greed Index: 20). ARB's superior liquidity and governance participation opportunities through ARB DAO mechanisms provide institutional-quality infrastructure alignment superior to VIC's nascent ecosystem.
⚠️ Disclaimer: This analysis is provided for informational purposes only and does not constitute investment advice, financial recommendation, or solicitation to purchase or sell any cryptocurrency. Cryptocurrency markets are highly volatile and unpredictable. Past performance does not guarantee future results. Investors should conduct thorough independent research, assess individual risk tolerance, and consult qualified financial advisors before making investment decisions.
Share
How to Buy Cryptocurrency


Trending Cryptocurrencies


ATS vs LRC: Comparing Automated Tracking Systems and Learning Resource Centers in Modern Education

DEEP vs OP: Unveiling the Power of Neural Networks in Competitive Gaming

Is Netswap (NETT) a good investment?: Analyzing the Potential and Risks of this DeFi Token

ONX vs LRC: Comparing Two Promising Blockchain Projects in the DeFi Space

Is Netswap (NETT) a good investment?: Analyzing the potential and risks of this decentralized exchange token
2025 DYDX Price Prediction: Analyzing Market Trends and Potential Growth Factors for the DeFi Token

What is PROPC: A Comprehensive Guide to Process-Oriented Programming and Control Structures

What is KRL: A Comprehensive Guide to the KUKA Robot Language and Its Applications in Industrial Automation
What is ALU: Understanding the Arithmetic Logic Unit and Its Role in Computer Processing
What is HEMI: A Comprehensive Guide to Chrysler's Revolutionary Engine Technology

What is GALFAN: A Revolutionary Coating Technology for Enhanced Corrosion Protection and Durability