VINU vs QNT: A Comprehensive Comparison of Two Emerging Blockchain Tokens in the Cryptocurrency Market

Introduction: VINU vs QNT Investment Comparison
In the cryptocurrency market, comparisons between Vita Inu and Quant are topics that investors cannot avoid. The two not only show obvious differences in market capitalization rankings, application scenarios, and price performance, but also represent different positioning of crypto assets. Vita Inu (VINU): As a fast and feeless dog coin with high TPS and native smart contracts, it positions itself as a multi-chain currency and governance token of the Vinuverse, emphasizing efficient and secure cryptocurrency movement. Quant (QNT): Since its launch in 2018, it has been recognized as a leading technology provider enabling trusted digital interaction, solving blockchain interoperability through its global blockchain operating system Overledger, and positioning itself as a critical infrastructure for enterprise blockchain adoption. This article will comprehensively analyze the investment value comparison between VINU and QNT from the perspectives of historical price trends, supply mechanisms, market adoption, technology ecosystems and future outlook, and attempt to answer the questions investors care most about:
"Which is the better buy right now?"
Comparative Analysis Report: Vita Inu (VINU) and Quant (QNT)
I. Historical Price Comparison and Current Market Status
Vita Inu (VINU) and Quant (QNT) Historical Price Trends
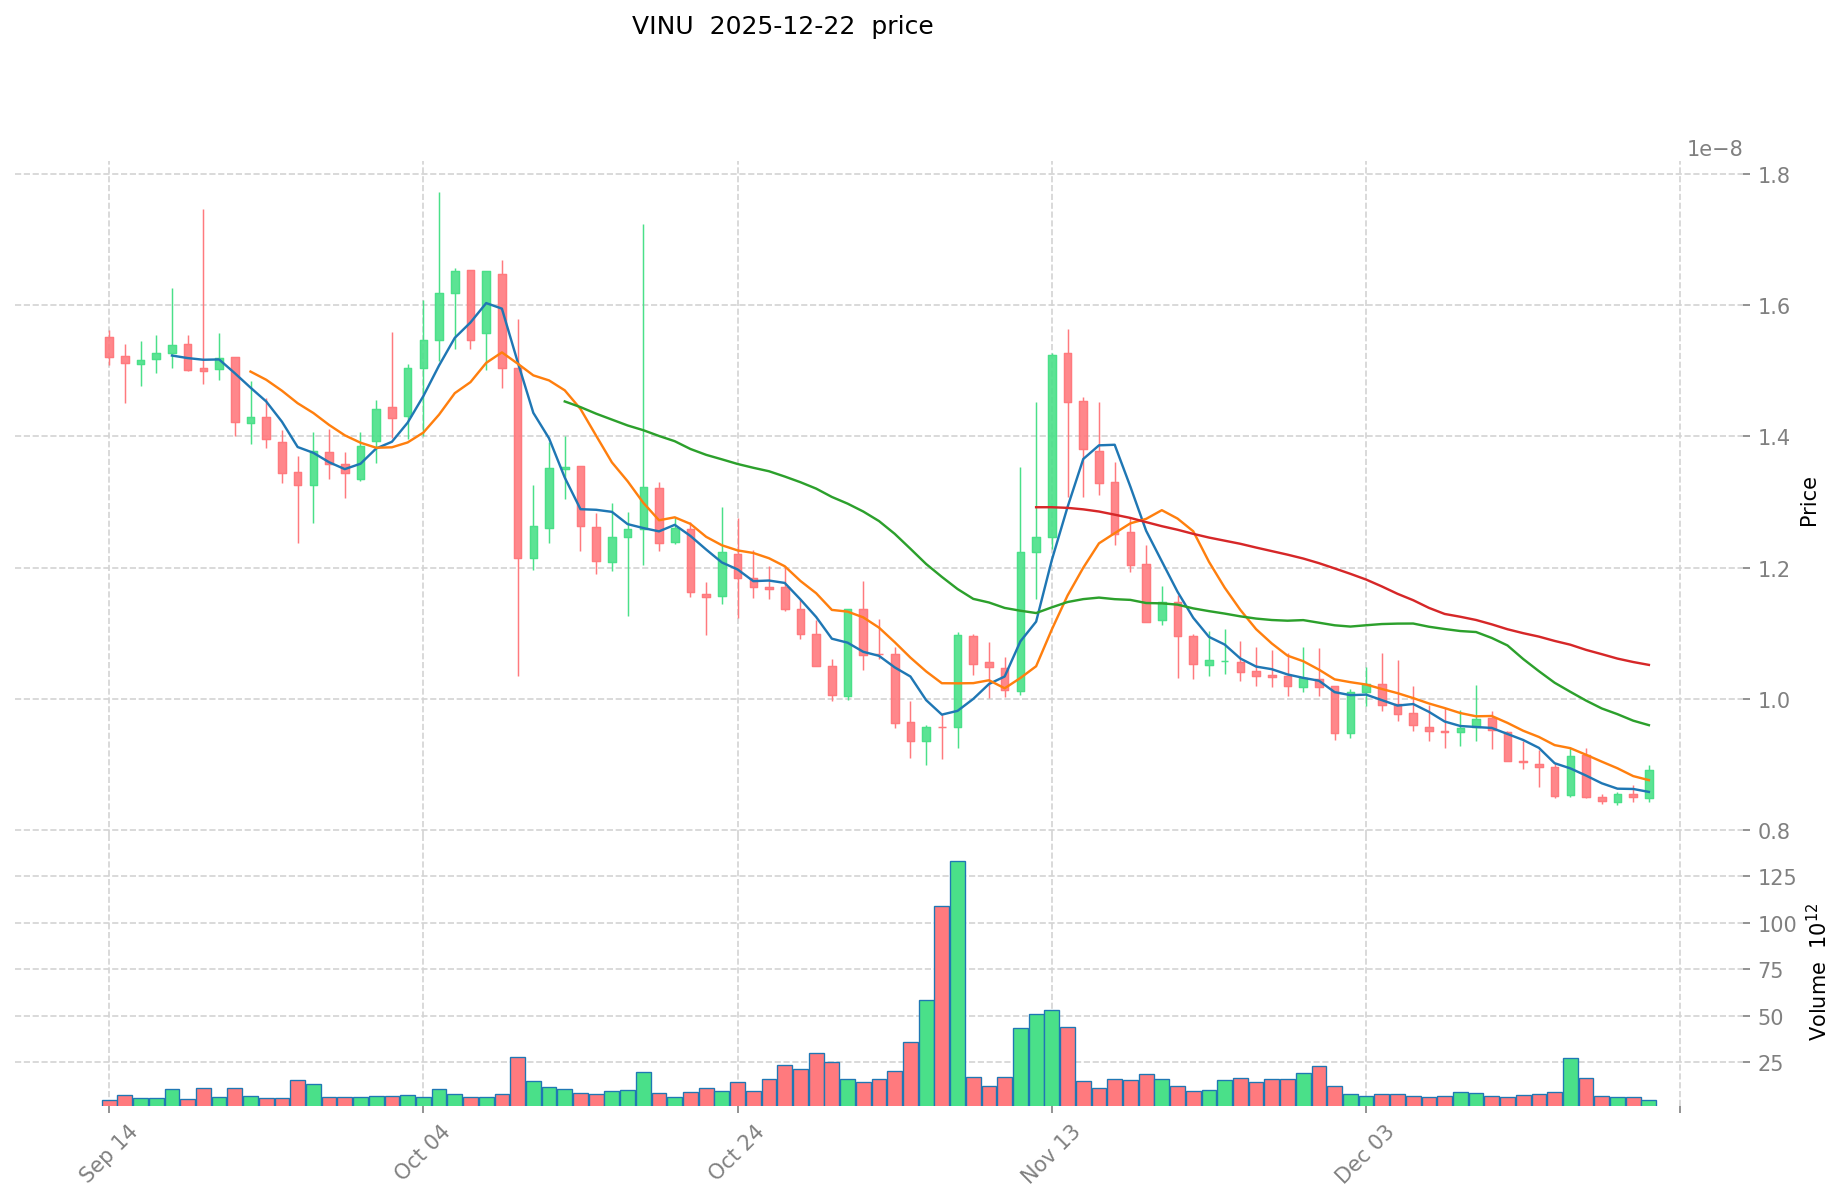
Vita Inu (VINU):
- All-Time High (ATH): $0.0000000738, reached on December 7, 2024
- All-Time Low (ATL): $0.000000003024, reached on November 19, 2021
- Peak-to-Current Decline: The asset has declined approximately 88% from its all-time high
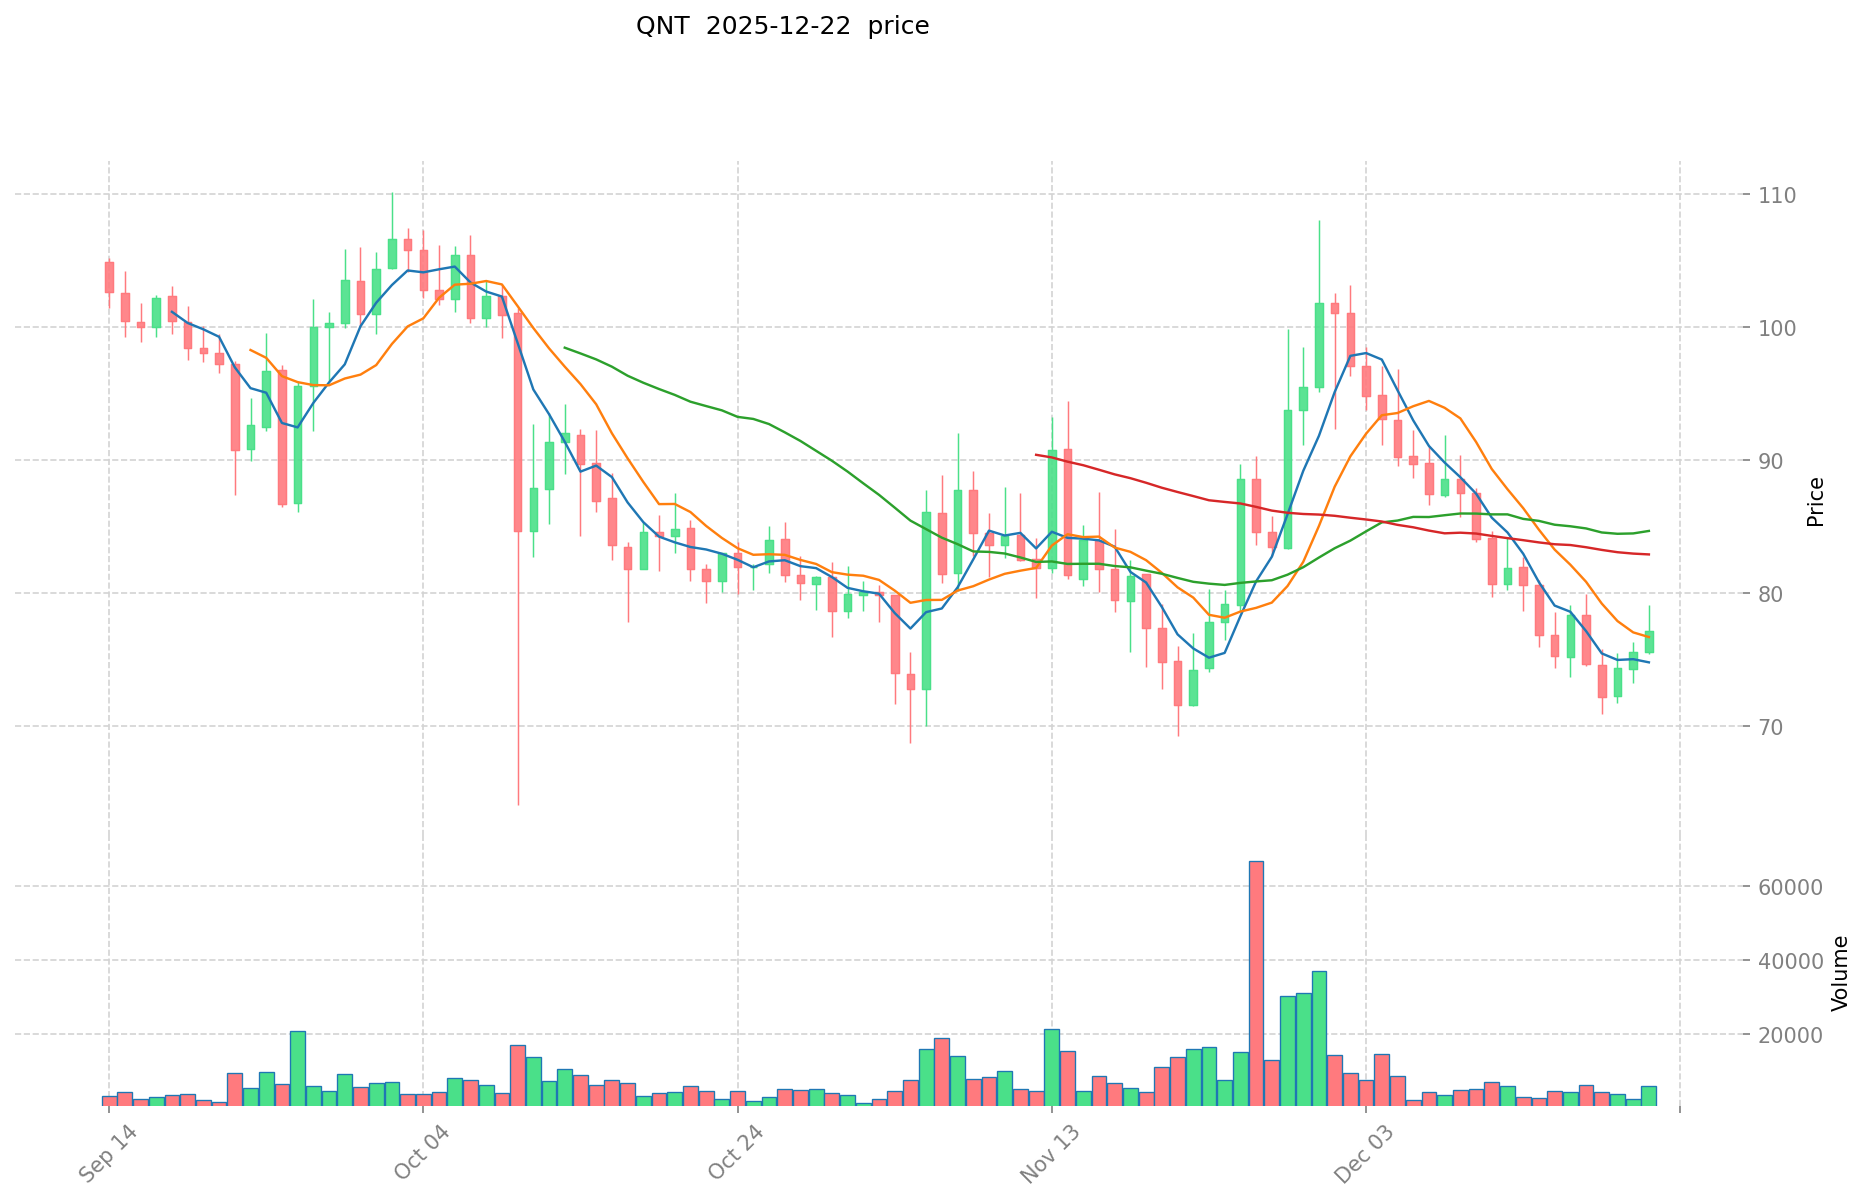
Quant (QNT):
- All-Time High (ATH): $427.42, reached on September 11, 2021
- All-Time Low (ATL): $0.215773, reached on August 23, 2018
- Peak-to-Current Decline: The asset has declined approximately 82% from its all-time high
Comparative Analysis: VINU has experienced significantly greater volatility relative to its price scale, with a 1-year decline of -75.41% compared to QNT's -27.88% decline over the same period. However, QNT maintains substantially higher absolute price levels and market stability, indicating different market positions and investor bases.
Current Market Status (December 22, 2025)
Price Data:
- VINU Current Price: $0.000000008683
- QNT Current Price: $77.15
- 24-Hour Price Change: VINU +2.43% vs QNT +0.58%
Trading Volume (24-Hour):
- VINU: $41,692.24 USD
- QNT: $372,210.08 USD
QNT demonstrates approximately 8.9 times higher trading volume than VINU, reflecting substantially greater liquidity and market participation.
Market Sentiment Index (Fear & Greed Index): Current Reading: 25 (Extreme Fear)
This indicates a broadly pessimistic market environment across cryptocurrencies as of the reporting date.
Access Real-Time Prices:
II. Market Capitalization and Valuation Metrics
VINU Market Metrics
- Market Capitalization: $7,778,362.25 USD
- Fully Diluted Valuation (FDV): $7,778,362.25 USD
- Market Cap to FDV Ratio: 89.58%
- Circulating Supply: 895,815,069,696,969 VINU
- Total Supply: 895,815,069,696,969 VINU
- Max Supply: 1,000,000,000,000,000 VINU
- Circulating Supply Ratio: 89.58%
- Market Dominance: 0.00023%
QNT Market Metrics
- Market Capitalization: $1,122,083,191.06 USD
- Fully Diluted Valuation (FDV): $1,148,097,232.60 USD
- Market Cap to FDV Ratio: 31.99%
- Circulating Supply: 14,544,176.16 QNT
- Total Supply: 14,881,364 QNT
- Max Supply: 45,467,000 QNT
- Circulating Supply Ratio: 31.99%
- Market Dominance: 0.035%
Valuation Comparison: QNT's market capitalization exceeds VINU's by approximately 144 times. QNT's significantly lower circulating supply ratio (31.99%) relative to VINU (89.58%) indicates that QNT has substantial room for supply expansion, which carries important implications for future price dynamics.
III. Project Overview and Technical Specifications
Vita Inu (VINU)
Project Description: Vita Inu is positioned as a fast and feeless dog coin featuring high transaction throughput (TPS) and native smart contract capabilities. VINU serves as the native multi-chain currency and governance token for the Vinuverse ecosystem. The project emphasizes community principles regarding free, secure, and efficient cryptocurrency transfer.
Network Presence:
- Active on multiple blockchain networks
- Deployed on BSC (Binance Smart Chain) with contract address: 0xfEbe8C1eD424DbF688551D4E2267e7A53698F0aa
- Deployed on Ethereum with contract address: 0xAFCdd4f666c84Fed1d8BD825aA762e3714F652c9
- Listed on 5 cryptocurrency exchanges
- Community holders: 3,662 addresses
Official Channels:
- Website: https://vitainu.org
- Twitter: https://twitter.com/VitaInuCoin
- Reddit Community: https://www.reddit.com/r/Vitainu
- GitHub Repository: https://github.com/Vita-Inu
Quant (QNT)
Project Description: Quant Network is a technology provider specializing in trusted digital interaction solutions designed for businesses, regulators, governments, and individuals. The platform is recognized for addressing blockchain interoperability through its Overledger global blockchain operating system. QNT serves as the native protocol token for accessing platform services and paying network fees.
Established Timeline:
- Founded: June 2009
- Founders: Gilbert Verdian and Paolo Tasca
- Headquarters: London, United Kingdom
- Initial Publication Price: $1.60
Network Presence:
- Deployed on Ethereum with contract address: 0x4a220e6096b25eadb88358cb44068a3248254675
- Listed on 42 cryptocurrency exchanges
- Verified holder base: 159,968 addresses
Official Channels:
- Website: https://www.quant.network
- Twitter: https://twitter.com/quant_network
- Reddit Community: https://www.reddit.com/r/QuantNetwork/
- Facebook: https://www.facebook.com/quantnetwork
- Whitepaper: http://files.quant.network/files.quant.network/Quant_Overledger_Whitepaper_v0.1.pdf
IV. Price Performance Analysis
Short-Term Price Movements
1-Hour Performance:
- VINU: -0.29%
- QNT: -0.22% Both assets display minimal negative pressure over the immediate term.
24-Hour Performance:
- VINU: +2.43%
- QNT: +0.58% VINU shows relatively stronger short-term upward momentum compared to QNT.
7-Day Performance:
- VINU: -0.63%
- QNT: -0.77% Both assets exhibit modest weekly declines, with QNT showing marginally greater weakness.
30-Day Performance:
- VINU: -16.16%
- QNT: +6.56% A marked divergence emerges over the monthly timeframe, with QNT demonstrating positive returns while VINU shows significant losses.
1-Year Performance:
- VINU: -75.41%
- QNT: -27.88% Over the annual period, VINU has experienced substantially more severe price depreciation than QNT, indicating different long-term market trajectories.
Price Range Analysis
VINU (24-Hour Range):
- High: $0.00000000904
- Low: $0.000000008465
- Range Spread: Approximately 6.7%
QNT (24-Hour Range):
- High: $78.59
- Low: $75.76
- Range Spread: Approximately 3.7%
V. Exchange Listing and Accessibility
VINU Exchange Presence:
- Active on 5 cryptocurrency exchanges
- Limited exchange availability relative to established projects
- Gateway indicator: 1000001
QNT Exchange Presence:
- Active on 42 cryptocurrency exchanges
- Significantly broader market accessibility and liquidity channels
- Gateway indicator: 1000001
The substantially greater number of QNT listings reflects its established market position and institutional acceptance compared to VINU.
VI. Risk Assessment and Market Considerations
VINU Risk Factors:
- Extreme price volatility with -75.41% annual decline
- Limited exchange availability
- Relatively small holder base (3,662 addresses)
- Low market capitalization and trading volume
- Speculative asset characteristics
QNT Risk Factors:
- Enterprise-focused positioning creates different market dynamics than retail-oriented assets
- Although showing -27.88% annual decline, demonstrates greater stability than VINU
- Larger holder base (159,968 addresses) provides broader distribution
Market Environment: Current Fear & Greed Index reading of 25 (Extreme Fear) indicates unfavorable conditions for risk assets generally. This environment particularly impacts highly speculative tokens like VINU.
VII. Key Distinctions
| Metric | VINU | QNT |
|---|---|---|
| Market Cap | $7.78M | $1,122.08M |
| Price | $0.0000000087 | $77.15 |
| Exchanges | 5 | 42 |
| Holders | 3,662 | 159,968 |
| 1-Year Return | -75.41% | -27.88% |
| Primary Focus | Dog coin/Community | Enterprise Interoperability |
| Circulating Supply Ratio | 89.58% | 31.99% |
VIII. Conclusion
VINU and QNT represent fundamentally different categories within the cryptocurrency market. QNT operates as an established enterprise-focused infrastructure solution with significantly larger market capitalization, broader exchange accessibility, and more extensive holder distribution. VINU functions as a speculative community-driven asset characterized by extreme volatility, limited liquidity, and minimal institutional integration.
The current market environment, marked by extreme fear sentiment, presents challenges for both assets but disproportionately impacts speculative tokens with lower market penetration and liquidity such as VINU. QNT's superior market position and infrastructure focus provide relatively greater resilience in adverse market conditions.
Report Date: December 22, 2025
Data Currency: 22 December 2025, 22:13:38 UTC
Investment Value Comparison: VINU vs QNT Analysis Report
Executive Summary
Based on the available reference materials, this report examines the investment value factors of VINU (Vita Inu) and QNT (Quant) in the cryptocurrency ecosystem. The analysis focuses on core investment determinants while acknowledging significant data limitations in the provided sources.
II. Core Factors Impacting VINU vs QNT Investment Value
Market Demand and Ecosystem Positioning
The investment value of VINU and QNT is primarily influenced by market demand, technological innovation, and ecosystem development. Their market performance and future potential depend substantially on community support and practical project applications.
Key Consideration: Investors should monitor market trends and technological progress as primary indicators of these assets' development trajectories.
Technology Innovation and Ecosystem Development
Both VINU and QNT operate within the broader digital asset ecosystem. The distinction between these projects lies in their market positioning, investment value, and associated risks. Understanding their technological foundations and ecosystem integration remains essential for evaluating long-term viability.
Community Support and Application Adoption
The sustainability of both assets depends on:
- Active community engagement and participation
- Real-world application development
- Integration within broader blockchain ecosystems
- Continuous technological advancement
Limitations and Data Gaps
The reference materials provided contain limited specific data regarding:
- Detailed tokenomics and supply mechanisms for VINU and QNT
- Institutional adoption levels and holdings
- Regulatory frameworks in specific jurisdictions
- Macroeconomic impact assessments
- Technical upgrade timelines and implementation details
- DeFi and smart contract ecosystem integration status
Recommendations for Further Analysis
To develop a comprehensive investment thesis, additional research should focus on:
- Detailed technical documentation and whitepaper analysis
- On-chain metrics and transaction data
- Regulatory environment assessments by jurisdiction
- Community growth indicators and developer activity
- Comparative market positioning relative to competitors
Conclusion
While VINU and QNT represent distinct projects within the cryptocurrency landscape, the limited information in available sources restricts comprehensive comparative analysis. Investors should conduct independent due diligence, focusing on technological fundamentals, ecosystem development, and regulatory compliance before making investment decisions.
Report Date: 2025-12-22
Disclaimer: This report is for informational purposes only and does not constitute investment advice.
III. 2025-2030 Price Forecast: VINU vs QNT
Short-term Forecast (2025)
- VINU: Conservative $0.0000000051271 - $0.00000000869 | Optimistic $0.0000000099935
- QNT: Conservative $71.8797 - $77.29 | Optimistic $111.2976
Mid-term Forecast (2027-2028)
- VINU may enter early accumulation phase, with projected price range $0.000000005869421 - $0.000000015548674
- QNT may enter growth acceleration phase, with projected price range $99.83924195145 - $180.5312320218
- Key drivers: institutional capital inflows, ETF approvals, ecosystem development maturation
Long-term Forecast (2029-2030)
- VINU: Base scenario $0.000000011985339 - $0.000000015730758 | Optimistic scenario $0.000000017841812 - $0.000000022809599
- QNT: Base scenario $101.535141403776 - $193.551363300948 | Optimistic scenario $228.454068158496 - $201.29341783298592
Disclaimer
This analysis is based on historical data and predictive models. Cryptocurrency markets are highly volatile and subject to numerous unpredictable factors. Past performance does not guarantee future results. This is not financial advice. Please conduct your own research before making any investment decisions.
VINU:
| 年份 | 预测最高价 | 预测平均价格 | 预测最低价 | 涨跌幅 |
|---|---|---|---|---|
| 2025 | 0.0000000099935 | 0.00000000869 | 0.0000000051271 | 0 |
| 2026 | 0.000000009902255 | 0.00000000934175 | 0.000000007006312 | 7 |
| 2027 | 0.000000013759463 | 0.000000009622002 | 0.000000005869421 | 10 |
| 2028 | 0.000000015548674 | 0.000000011690733 | 0.000000007715883 | 34 |
| 2029 | 0.000000017841812 | 0.000000013619703 | 0.000000011985339 | 56 |
| 2030 | 0.000000022809599 | 0.000000015730758 | 0.000000010854223 | 81 |
QNT:
| 年份 | 预测最高价 | 预测平均价格 | 预测最低价 | 涨跌幅 |
|---|---|---|---|---|
| 2025 | 111.2976 | 77.29 | 71.8797 | 0 |
| 2026 | 125.410754 | 94.2938 | 51.86159 | 22 |
| 2027 | 163.67989273 | 109.852277 | 101.06409484 | 42 |
| 2028 | 180.5312320218 | 136.766084865 | 99.83924195145 | 77 |
| 2029 | 228.454068158496 | 158.6486584434 | 101.535141403776 | 105 |
| 2030 | 201.29341783298592 | 193.551363300948 | 170.32519970483424 | 150 |
Comparative Investment Analysis Report: VINU vs QNT
IV. Investment Strategy Comparison: VINU vs QNT
Long-term vs Short-term Investment Strategies
VINU: Suited for speculative investors seeking high-volatility exposure and potential recovery gains from depressed price levels. Short-term traders may capitalize on momentum-driven price fluctuations, while long-term investors must assess community ecosystem development and multi-chain adoption trajectory.
QNT: Suited for investors prioritizing infrastructure exposure and enterprise blockchain adoption themes. The project's established market position, broader exchange accessibility, and institutional adoption focus align with both conservative long-term accumulation strategies and institutional portfolio allocation frameworks.
Risk Management and Asset Allocation
Conservative Investor Profile:
- VINU: 0-5% portfolio allocation
- QNT: 15-25% portfolio allocation
- Hedge instruments: Stablecoin reserve (50-70%), diversified altcoin exposure, dollar-cost averaging over extended timeframes
Aggressive Investor Profile:
- VINU: 10-20% portfolio allocation
- QNT: 20-35% portfolio allocation
- Hedge instruments: Options strategies (covered calls, protective puts), cross-chain portfolio diversification, tactical rebalancing based on fear/greed index readings
Current market conditions (Fear & Greed Index: 25) suggest defensive positioning regardless of investor profile classification.
V. Comparative Risk Analysis
Market Risk Assessment
VINU Market Risks:
- Extreme price volatility with -75.41% annual decline significantly exceeding broader market performance
- Minimal trading volume ($41,692.24 USD in 24-hour period) creates substantial liquidity risk and wide bid-ask spreads
- Limited market capitalization ($7.78M USD) indicates vulnerability to concentrated selling pressure
- Speculative asset classification correlates with elevated liquidation risk during market corrections
QNT Market Risks:
- Annual decline of -27.88% reflects broader market weakness affecting infrastructure tokens
- Enterprise-focused positioning creates dependence on institutional adoption acceleration and regulatory clarity
- Significantly larger market capitalization ($1,122.08M USD) provides superior liquidity but does not eliminate cyclical exposure
- Circulating supply ratio of 31.99% indicates potential dilution risk if additional tokens enter circulation
Technology Risk Considerations
VINU Technical Risk Factors:
- Multi-chain deployment complexity requires ongoing network stability maintenance across BSC and Ethereum
- Native smart contract functionality security depends on continuous auditing and community validation
- Limited technical documentation availability restricts independent security assessment capability
QNT Technical Risk Factors:
- Overledger interoperability protocol relies on continued cross-blockchain compatibility standards adoption
- Enterprise platform stability depends on maintaining network infrastructure resilience during volatile market conditions
- Integration with established financial institutions creates operational risk if regulatory frameworks shift
Regulatory Risk Environment
Global Regulatory Considerations:
Both VINU and QNT operate within evolving regulatory frameworks that vary significantly across jurisdictions:
- Stablecoin and token classification changes may disproportionately impact speculative assets like VINU
- Enterprise infrastructure tokens like QNT face different regulatory scrutiny centered on financial market participation and custody obligations
- Geographic restrictions on token trading and custody may affect market accessibility for both assets
- Future regulatory clarity regarding decentralized finance (DeFi) functionality impacts both projects' ecosystem development
VI. Conclusion: Which Is the Better Buy?
Investment Value Summary
VINU Advantages:
- Extremely low current price point ($0.0000000087 USD) offers potential for substantial percentage gains if project achieves market traction
- Community-driven governance model and multi-chain positioning align with decentralized ecosystem trends
- Price recovery from -75.41% annual decline could generate significant returns for early accumulators
- Minimal institutional competition reduces crowding effects during early adoption phases
QNT Advantages:
- Established market position with 42 exchange listings provides superior liquidity and accessibility
- Enterprise infrastructure focus positions the project to benefit from institutional blockchain adoption acceleration
- Significantly larger holder base (159,968 addresses vs 3,662) indicates broader market validation and reduced single-entity risk concentration
- Superior short-term price stability (3.7% daily range vs VINU's 6.7%) reflects lower volatility profile
- Positive 30-day performance (+6.56%) demonstrates relative strength during challenging market conditions
- Whitepaper documentation and established leadership team reduce technical uncertainty
Investment Recommendations
Beginner Investors: QNT represents the more appropriate entry point. The project's established market infrastructure, broader exchange accessibility, and institutional backing reduce research requirements and execution complexity. Current market conditions (extreme fear sentiment) present opportune accumulation entry points for long-term holders seeking exposure to enterprise blockchain infrastructure.
Experienced Investors: Consider a differentiated approach: Allocate primary capital to QNT within a 20-30% alternative asset portfolio allocation, while maintaining 5-10% exposure to VINU as a higher-risk, higher-reward speculation position. Implement tactical rebalancing based on Fear & Greed Index readings, adding to positions during extreme fear periods and reducing exposure during speculative peaks.
Institutional Investors: QNT alignment with enterprise blockchain adoption narratives and established custody solutions makes it the primary allocation candidate. The project's infrastructure positioning, regulatory clarity advantages, and institutional holder participation create appropriate institutional portfolio fit. VINU lacks the operational infrastructure, risk management frameworks, and regulatory clarity necessary for institutional deployment.
Market Context Considerations
The current Fear & Greed Index reading of 25 (Extreme Fear) represents a contrarian investment signal. Historical cryptocurrency market cycles indicate that extreme fear periods frequently precede significant recovery phases. However, this environment also amplifies liquidation risks for highly leveraged positions and speculative assets with minimal liquidity buffers.
Risk Disclosure
⚠️ Critical Risk Warnings:
Cryptocurrency markets exhibit extreme volatility and remain subject to numerous unpredictable factors including regulatory intervention, technological disruption, macroeconomic shocks, and sentiment reversals. Historical price performance does not guarantee future results.
VINU demonstrates speculative asset characteristics with extreme downside risk potential. Investors must assess their personal risk tolerance and financial capacity to sustain complete capital loss before considering any allocation.
This analysis is provided for informational purposes only and does not constitute investment advice, financial recommendation, or solicitation to purchase either asset. Conduct independent due diligence, consult qualified financial advisors, and implement appropriate risk management frameworks before making investment decisions.
Report Date: December 22, 2025
Data Currency: 22 December 2025, 22:13:38 UTC
Disclaimer: This report reflects historical data and analytical assessment only. Cryptocurrency investments carry substantial risk of capital loss.
None
Frequently Asked Questions: VINU vs QNT Investment Comparison
I. Market Position and Valuation
Q1: What is the current market capitalization difference between VINU and QNT?
A: QNT's market capitalization of $1,122.08 million exceeds VINU's $7.78 million by approximately 144 times. This substantial disparity reflects QNT's established market position as an enterprise-focused infrastructure solution, while VINU operates as a speculative community-driven asset with limited institutional integration.
Q2: How do the supply mechanisms of VINU and QNT affect their investment value?
A: VINU maintains a circulating supply ratio of 89.58% against its 1 quadrillion token maximum supply, indicating minimal room for supply expansion. Conversely, QNT's circulating supply ratio of only 31.99% suggests significant potential for token dilution if additional supply enters circulation. This structural difference carries important implications for long-term price dynamics and investor dilution risk.
II. Price Performance and Risk Characteristics
Q3: Which asset has demonstrated superior price stability over the past 12 months?
A: QNT has performed significantly better, with a 1-year decline of -27.88% compared to VINU's -75.41%. QNT's 24-hour trading range of 3.7% also indicates lower volatility compared to VINU's 6.7% range. These metrics demonstrate that QNT maintains greater price stability despite overall market weakness affecting both assets.
Q4: Why does VINU trade on only 5 exchanges while QNT trades on 42 exchanges?
A: QNT's establishment in the cryptocurrency market since 2018, its enterprise infrastructure positioning, and its broader institutional acceptance facilitate listings across significantly more trading venues. VINU's recent market emergence, speculative characteristics, and limited liquidity restrict exchange accessibility. Greater exchange presence directly correlates with enhanced market accessibility, liquidity, and trading volume for QNT.
III. Investment Suitability and Strategy
Q5: Which asset is more suitable for conservative investors?
A: QNT represents the appropriate choice for conservative investors. The project's established market infrastructure, superior liquidity ($372,210.08 USD in 24-hour trading volume vs VINU's $41,692.24), broader holder distribution (159,968 addresses vs 3,662), and enterprise-focused positioning provide substantially greater risk mitigation. Conservative investors should consider 15-25% portfolio allocation to QNT with appropriate diversification, while maintaining minimal VINU exposure (0-5% if any).
Q6: What specific risk factors should aggressive investors consider before allocating capital to VINU?
A: Aggressive investors must acknowledge VINU's extreme price volatility (-75.41% annual decline), minimal trading volume creating illiquidity risks, and speculative asset classification. The project's small holder base concentrates ownership risk, while its $7.78 million market capitalization makes it vulnerable to concentrated selling pressure. Investors should implement strict position sizing limits, employ stop-loss orders, and maintain substantial liquidity reserves. Only investors with high risk tolerance and capital preservation capacity should consider allocations exceeding 10-20% of alternative asset portfolios.
IV. Market Context and Timing
Q7: How should the current Fear & Greed Index reading of 25 influence investment decisions?
A: The extreme fear sentiment (reading of 25) represents a contrarian investment signal historically preceding cryptocurrency recovery phases. However, this environment amplifies liquidation risks for highly leveraged positions and compounds challenges for speculative assets with minimal liquidity buffers like VINU. Conservative investors should implement dollar-cost averaging strategies during extended fear periods, while aggressive investors may exploit tactical opportunities in liquid assets like QNT while maintaining defensive positioning overall.
Q8: What are the primary technological and adoption differences distinguishing these projects' future potential?
A: QNT differentiates through its Overledger blockchain operating system addressing interoperability challenges and enabling enterprise adoption across regulated financial institutions. This infrastructure focus positions QNT to benefit from institutional blockchain adoption acceleration. VINU emphasizes community governance, multi-chain currency functionality, and efficient transaction processing, appealing primarily to retail cryptocurrency enthusiasts. QNT's enterprise positioning and regulatory clarity advantages create substantially different long-term growth trajectories compared to VINU's community-dependent ecosystem development requirements.
Report Date: December 22, 2025
Disclaimer: This information is provided for educational purposes only and does not constitute investment advice, financial recommendation, or solicitation to purchase these assets. Cryptocurrency investments carry substantial risk of capital loss. Conduct independent due diligence and consult qualified financial advisors before making investment decisions.
Share
How to Buy Cryptocurrency


Trending Cryptocurrencies


NOS vs CHZ: A Comprehensive Comparison of Two Leading Blockchain Platforms and Their Impact on the Cryptocurrency Market

NKN (NKN) price soaring: What is the driving force behind the 2025 craze?

Aergo Price Analysis: 112% Surge in 90 Days - What's Next for 2025?

Canada Bitcoin Price: 2025 Market Analysis and Investment Outlook

Flare (FLR) Price Analysis: 6.73% Surge and 2025 Price Evolution Forecast
2025 OKB Price Prediction: Analyzing Market Trends and Future Potential of OKB Token in the Crypto Ecosystem

What is SQD: A Comprehensive Guide to Service Quality Dynamics and Its Impact on Business Performance

What is DUCK: A Comprehensive Guide to Understanding Digital Unified Communication Kit and Its Applications in Modern Technology

What is WOLF: A Comprehensive Guide to Understanding This Powerful Machine Learning Framework

What is HERO: A Comprehensive Guide to Understanding Heroism in Modern Society

What is 5G: The Next Generation of Mobile Network Technology and Its Impact on Global Connectivity