
Date: Fri, Dec 26, 2025 | 06:30 PM GMT
The broader cryptocurrency market has been navigating a period of choppy and uncertain price action over the past several weeks, a phase that began after the sharp market-wide sell-off on October 10. During that correction, Ethereum (ETH) dropped nearly 28% over the last 60 days, applying sustained pressure across the altcoin sector — including ether.fi (ETHFI).
ETHFI has mirrored this weakness, sliding more than 31% over the same period. However, despite the sharp downtrend, recent price behavior suggests selling pressure may be easing. The token is now trading near a historically significant demand zone, where buyers have repeatedly stepped in before — raising the possibility that ETHFI could be approaching an inflection point.
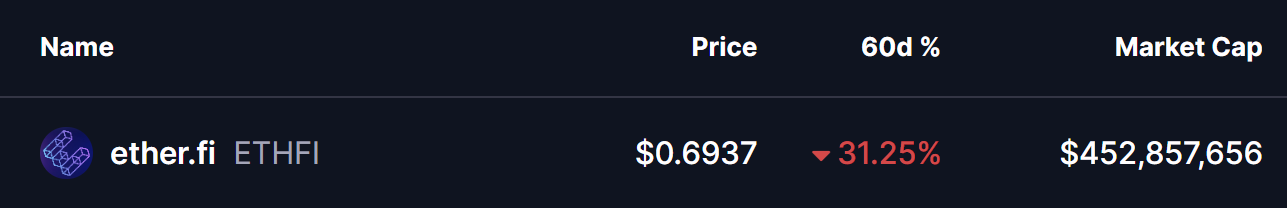
Source: Coinmarketcap
Double Bottom Pattern in Focus
On the daily timeframe, ETHFI appears to be forming a potential double-bottom structure — a classic reversal pattern that often signals exhaustion among sellers. The setup began after ETHFI was rejected from the $0.9233 resistance area, a move that triggered a sharp decline of nearly 28% and pushed price back toward the lower end of its range.
That sell-off dragged ETHFI into the $0.65 support zone, a level that has consistently acted as a strong demand area in the past. The chart now shows price revisiting this same region and stabilizing once again, suggesting buyers are actively defending it. The similarity between the first and second lows strengthens the case that a double-bottom base may be forming.
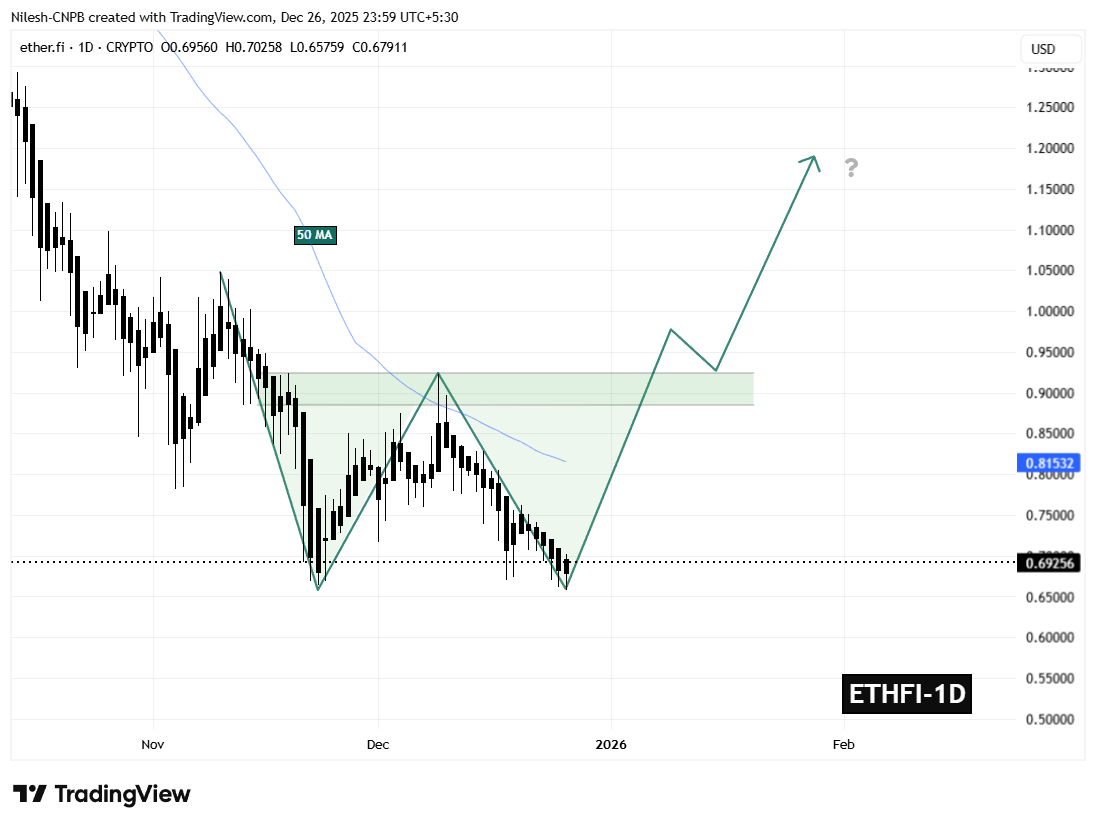
ETHFI Daily Chart/Coinsprobe (Source: Tradingview)
If this support continues to hold, the ongoing consolidation could mark the completion of the second bottom — a critical step in shifting momentum away from sellers and toward a potential trend reversal.
What’s Next for ETHFI?
The $0.65 support zone remains the most important level to monitor in the near term. As long as ETHFI holds above this area, the developing bullish structure remains valid and provides room for momentum to gradually rebuild.
On the upside, the first major challenge sits at the 50-day moving average near $0.8153. This level has repeatedly capped recovery attempts throughout the recent downtrend and now represents the initial test for buyers. A sustained move above this moving average would signal improving market structure and growing bullish confidence.
Beyond that, the $0.9233 neckline stands as the key confirmation level. A decisive breakout above this resistance would complete the double-bottom pattern and significantly strengthen the bullish outlook, potentially opening the door for a broader recovery move in the weeks ahead.
For now, ETHFI finds itself at a technically pivotal zone — one that could either reinforce the existing downtrend or mark the beginning of a meaningful rebound if buyers continue to defend support.
Disclaimer: The views and analysis presented in this article are for informational purposes only and reflect the author’s perspective, not financial advice. Technical patterns and indicators discussed are subject to market volatility and may or may not yield the anticipated results. Investors are advised to exercise caution, conduct independent research, and make decisions aligned with their individual risk tolerance.
Disclaimer: The information on this page may come from third parties and does not represent the views or opinions of Gate. The content displayed on this page is for reference only and does not constitute any financial, investment, or legal advice. Gate does not guarantee the accuracy or completeness of the information and shall not be liable for any losses arising from the use of this information. Virtual asset investments carry high risks and are subject to significant price volatility. You may lose all of your invested principal. Please fully understand the relevant risks and make prudent decisions based on your own financial situation and risk tolerance. For details, please refer to
Disclaimer.
Related Articles
Whale Frenzy: $2 Billion Bitcoin Purchase as Market Watches Powell Speech for Potential BTC Breakthrough Above $75,000
Bitcoin price has fallen back to $74,000, with the market paying close attention to Fed Chair Powell's speech. Ongoing whale buying and ETF inflows demonstrate long-term demand, but short-term selling pressure should be watched carefully. Market sentiment is improving, and volatility could increase.
GateNews5m ago
On-chain analyst: Bitcoin market overheating phenomenon eliminated, but seller pressure remains unrelieved
On March 18, on-chain data analyst Axel released a report indicating that the Bitcoin market has moved out of an overheated state, but selling pressure still exists and no reversal signals have appeared. The MVRV Z-Score indicator has dropped to 0.674, suggesting that the bubble has been deflated; meanwhile, the aSOPR indicator remains below 1.0, indicating that the market is still in a loss-selling phase, with a rebound facing the risk of selling pressure.
GateNews8m ago
Ethereum Surges 25% in March, Institutional Buying and ETF Issuance Drive ETH Price Gains
Analysts point out that Ethereum has recently outperformed the S&P 500 index, though Federal Reserve policy decisions may impact its upward momentum. Despite prices remaining below last year's highs, institutional investors are actively increasing positions, demonstrating strengthened confidence in Ethereum, while the launch of new ETFs also reflects sustained market interest in digital assets and decentralized finance.
GateNews14m ago
Bitcoin Faces Obstacle at $75,000: Federal Reserve Meeting and Middle East Situation May Become Key Turning Points
Bitcoin's upward momentum weakened after touching $75,000, with market concerns about a near-term peak. Despite continued institutional accumulation pushing total open interest to $58 billion, prices face pressure from macro uncertainty. Bitcoin ETF inflows exceeding $1.5 billion support the price. Market focus remains on the Federal Reserve meeting and geopolitical situation, which may impact near-term trends.
GateNews31m ago
Why Does Ethereum Price "Rise with Bitcoin but Ignore Fundamentals"? Bitwise Reveals: 65% of Price Movement Determined by Bitcoin
Bitwise's research indicates that Ethereum's price movements are primarily driven by Bitcoin and macroeconomic liquidity, with relatively weak influence from on-chain fundamentals. The model shows that Bitcoin volatility can explain 65% of Ethereum's volatility, while accommodative monetary conditions and ETF fund flows also contribute to Ethereum's price. The current market views Ethereum as a "network commodity," and its price movements in the short term may still be dominated by Bitcoin and the liquidity environment.
GateNews36m ago
