
Date: Thu, Jan 01, 2026 | 10:30 AM GMT
As the new year 2026 begins, the broader cryptocurrency market is showing modest weakness, with both Bitcoin (BTC) and Ethereum (ETH) trading slightly in the red. This soft start has weighed on sentiment across the altcoin space as well, including Monad (MON). However, beneath the surface, MON’s chart structure is beginning to tell a more constructive story.
MON is currently down around 4% on the day, extending its 60-day decline to roughly 21%. While short-term price action remains subdued, the more important signal is emerging on the daily chart, where price structure is beginning to hint at a meaningful shift. If confirmed, this setup could mark the early stages of a bullish continuation following a prolonged corrective phase.
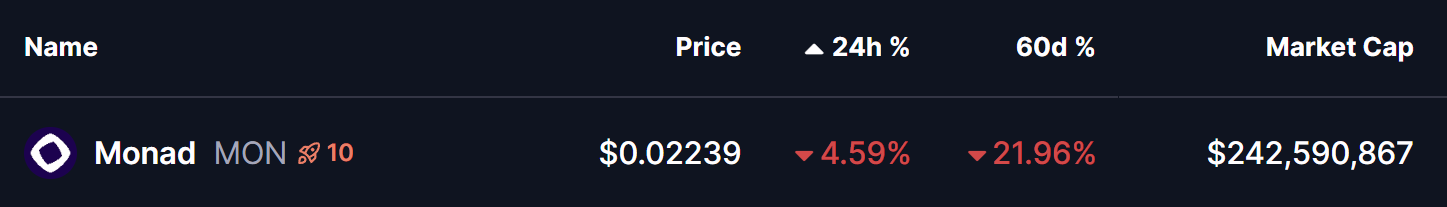
Source: Coinmarketcap
Rounding Bottom in Play
On the daily timeframe, MON appears to be forming a textbook rounding bottom pattern — a classic bullish reversal structure that typically develops after extended downside pressure. This pattern reflects a gradual transition from distribution to accumulation, where selling momentum weakens and buyers begin to step in more consistently.
Previously, MON faced strong rejection near the $0.04923 neckline zone, triggering a sharp decline that unfolded through late November and December. That move eventually found a floor near the $0.017 level, which has since acted as a key demand zone. Repeated defenses of this area prevented any deeper breakdown and helped establish a stable base for a potential trend reversal.
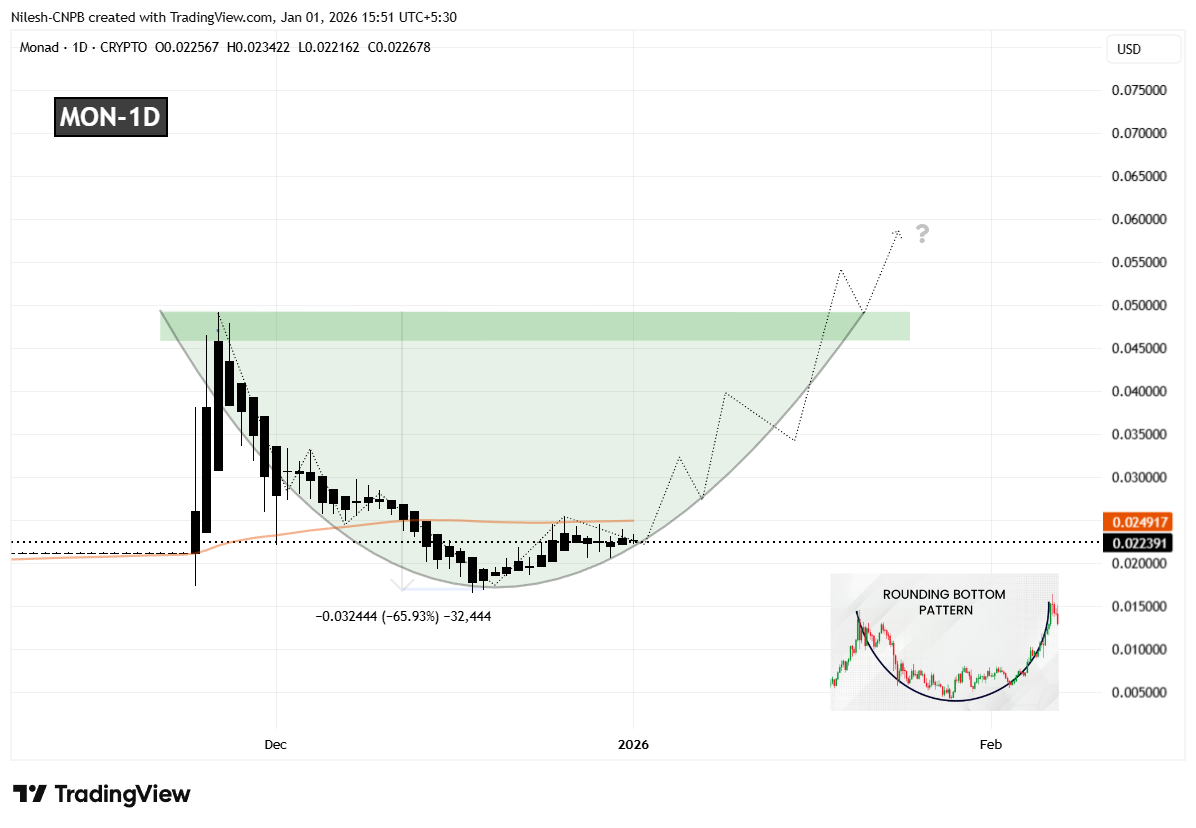
Monad (MON) Daily Chart/Coinsprobe (Source: Tradingview)
Since forming that bottom, MON has started to curve higher in a rounded fashion, closely matching the classic structure of a developing bottoming pattern. This gradual recovery suggests that selling pressure is fading rather than accelerating. The recent stabilization and recovery back above the $0.022 region further indicate that accumulation may be taking place as the market quietly prepares for a larger move.
What’s Next for MON?
For the rounding bottom pattern to move into confirmation, MON needs to reclaim the 50-day moving average, currently positioned near the $0.02491 level. A sustained move above this area would signal a shift in short-term momentum and confirm that buyers are beginning to regain control after months of corrective price action.
Looking ahead, the most significant technical hurdle remains the neckline resistance around $0.04923. A clean and decisive breakout above this zone would validate the entire reversal structure and could open the door for a broader bullish expansion phase, with momentum traders likely returning to the market.
Until those levels are reclaimed, the pattern remains in its early development stage. Short-term pullbacks or consolidation remain possible if MON struggles near the 50-day moving average. However, as long as price continues to hold higher lows above the $0.017 base, the broader bottoming structure remains intact.
Overall, MON’s emerging rounding bottom formation suggests the token may be approaching an important inflection point. While confirmation is still pending, the improving structure and alignment with a classic bullish pattern indicate that the coming sessions could be decisive for Monad’s next directional move.
Disclaimer: The views and analysis presented in this article are for informational purposes only and reflect the author’s perspective, not financial advice. Technical patterns and indicators discussed are subject to market volatility and may or may not yield the anticipated results. Investors are advised to exercise caution, conduct independent research, and make decisions aligned with their individual risk tolerance.
About Author: Nilesh Hembade is the Founder and Lead Author of Coinsprobe, with over 5 years of experience in the cryptocurrency and blockchain industry. Since launching Coinsprobe in 2023, he has been providing daily, research-driven insights through in-depth market analysis, on-chain data, and technical research.

Disclaimer: The information on this page may come from third parties and does not represent the views or opinions of Gate. The content displayed on this page is for reference only and does not constitute any financial, investment, or legal advice. Gate does not guarantee the accuracy or completeness of the information and shall not be liable for any losses arising from the use of this information. Virtual asset investments carry high risks and are subject to significant price volatility. You may lose all of your invested principal. Please fully understand the relevant risks and make prudent decisions based on your own financial situation and risk tolerance. For details, please refer to
Disclaimer.
Related Articles
Bitcoin Tops $68K Briefly as Risk Sentiment Improves on Iran War Report
Bitcoin's price surged to $68,000 amid easing geopolitical tensions and improved investor sentiment. However, weak ETF inflows and extreme market fear signal a cautious outlook, indicating potential challenges to a sustained recovery.
LiveBTCNews12m ago
ETH 15-minute rise of 0.59%: ETF event expectations drive the intraday upward move
From 2026-03-31 13:45 to 14:00 (UTC), the ETH spot market recorded a +0.59% return. The price ranged from 2063.14 to 2079.88 USDT, with a volatility of 0.81%. During this period, market fluctuations slightly increased, activity became more prominent, and ETF-related events drew market attention. Traders’ sentiment focused on the upcoming capital flows associated with these events.
The main driver behind this movement was related to ETH ETF market developments. On March 31, 2026, regarding “Ethereum ETF Flo” (the original text is incomplete here, but the translation continues with the full content), the market reacted to the news and expectations surrounding the approval and launch of Ethereum ETFs, which influenced trading behavior and sentiment.
GateNews56m ago
Downside risk remains as bitcoin nears record-tying six-month losing streak
Bitcoin is nearing a record of six consecutive monthly losses, with declines in October, November, and December. While current support levels are holding, macroeconomic factors and ongoing conflicts pose risks to recovery.
CoinDesk1h ago
BTC Price Plunges to 3-Week Low as Analysts Map Out Next Downside Targets
The first breakdown to under $68,000 seemed as just the beginning for bitcoin’s Friday correction, which just worsened with another dip to a fresh 3-week low.
Most altcoins have followed suit, which has harmed over-leveraged traders, with more than 120,000 such participants being wrecked in the
CryptoPotato1h ago
Bitcoin Cash and NEAR Protocol lead CoinDesk 20 as the market trades sideways
Bitcoin Cash and NEAR Protocol emerged as leaders in the CoinDesk 20 index as the cryptocurrency market remained stagnant. While the index showed no significant movement, BCH increased by 1.5% and NEAR by 1.9%, indicating selective investor interest despite overall market caution.
TapChiBitcoin1h ago
ETH 15-minute price up 0.61%: Active buying comes in, and a breakout above a key level in tandem boosts short-term performance
2026-03-31 13:00 to 13:15 (UTC), ETH fluctuated within the 2047.63 to 2061.18 USDT range. The 15-minute candlestick return recorded +0.61%, with a range of 0.66%. During this period, market attention clearly increased; short-term long sentiment edged upward, volatility intensified, and it attracted incremental liquidity to enter.
The main drivers behind this anomaly are a slight uptick in on-chain trading volume and the emergence of aggressive buy orders. ETH’s on-chain average daily number of transactions remained at a high level of 2,000,000. In the window, spot market trading volume increased, and on-chain transfers accounted for a significant portion of the activity, reflecting increased market participation and liquidity inflows.
GateNews1h ago
