
**Date: **Sat, Jan 03, 2025 | 01:26 PM GMT
As 2026 kicks off, the broader cryptocurrency market is showing renewed stability. Ethereum (ETH) has reclaimed the $3,100 level, and several major altcoins are already beginning to pick up momentum. Against this improving backdrop, Kaspa (KAS) is quietly positioning itself as a potential late mover, with its chart structure starting to flash early bullish signals.
While KAS is trading slightly in the red today and remains mostly flat on the weekly timeframe, the more important story is unfolding beneath the surface. Recent price action suggests a meaningful structural shift may be underway — one that could mark the early stages of a bullish continuation if confirmed.
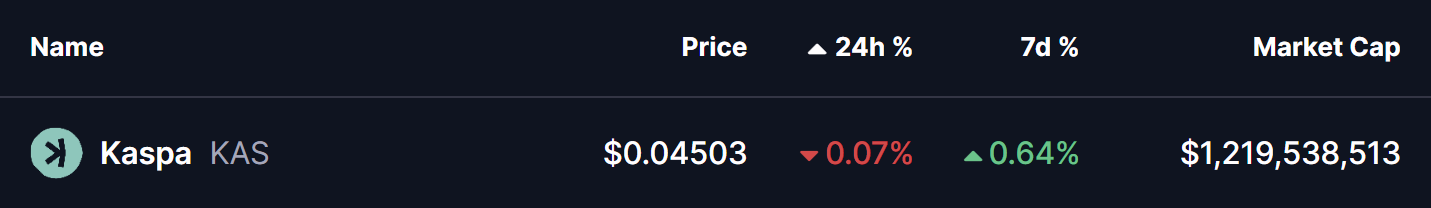
Source: Coinmarketcap
Rounding Bottom in Play
On the 4-hour timeframe, Kaspa appears to be forming a rounding bottom pattern, a classic bullish reversal structure that typically develops after a prolonged corrective phase. This pattern reflects a slow but steady transition from distribution to accumulation, as selling pressure weakens and buyers gradually regain control.
The setup began after KAS faced strong rejection near the $0.06310 neckline zone, which triggered a sharp decline through late November and December. That downside move eventually found strong demand near the $0.040 level, which has since acted as a key support area. Multiple defenses of this zone prevented further downside and helped establish a stable base for a potential trend reversal.
Since carving out that bottom, KAS has started to curve higher in a smooth, rounded fashion — closely matching the textbook structure of a developing rounding bottom. The recent stabilization above the $0.045 region further supports the idea that downside momentum is fading.
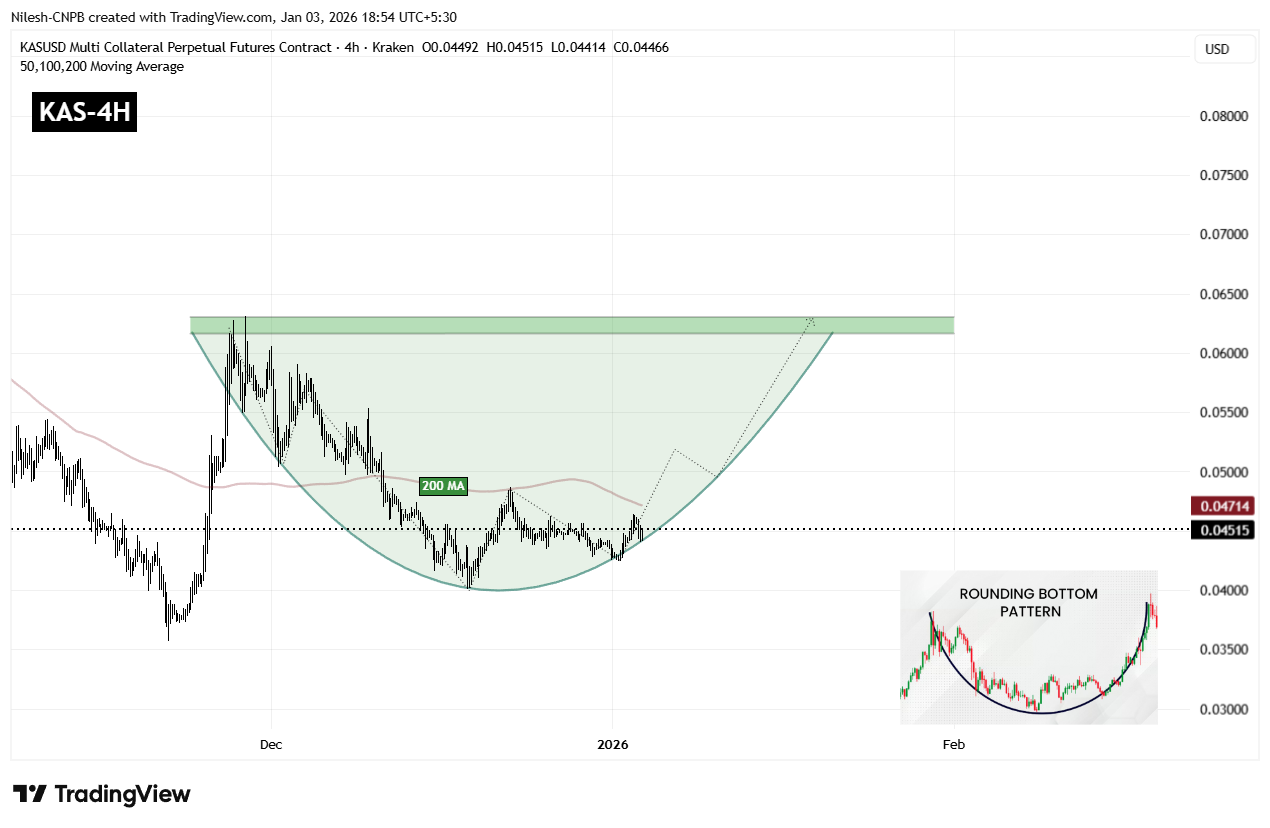
Kaspa (KAS) 4H Chart/Coinsprobe (Source: Tradingview)
A key technical level now comes into focus: the 200-period moving average, currently hovering near $0.04714. This level has acted as dynamic resistance during the recovery phase, and reclaiming it would mark an important shift in short-term market structure.
A sustained move above the 200 MA would indicate that buyers are regaining control after months of corrective price action and could act as the trigger for a stronger upside continuation.
What’s Next for KAS?
For full confirmation of the rounding bottom pattern, KAS must eventually reclaim the $0.06310 neckline resistance. A clean breakout above this zone would validate the entire reversal structure and could open the door to a broader bullish expansion phase, with momentum traders likely re-entering the market.
Until that breakout occurs, the pattern remains in development. Short-term consolidation or shallow pullbacks remain possible, especially near moving average resistance. However, as long as price continues to hold above the $0.04245 support base and maintains higher lows, the broader bottoming structure remains intact and constructive.
In the near term, all eyes remain on the 200 MA and the neckline zone. How Kaspa reacts around these levels will likely determine whether this emerging bullish setup evolves into a confirmed breakout move or requires more time to mature.
Disclaimer: The views and analysis presented in this article are for informational purposes only and reflect the author’s perspective, not financial advice. Technical patterns and indicators discussed are subject to market volatility and may or may not yield the anticipated results. Investors are advised to exercise caution, conduct independent research, and make decisions aligned with their individual risk tolerance.
About Author: Nilesh Hembade is the Founder and Lead Author of Coinsprobe, with over 5 years of experience in the cryptocurrency and blockchain industry. Since launching Coinsprobe in 2023, he has been providing daily, research-driven insights through in-depth market analysis, on-chain data, and technical research.

Disclaimer: The information on this page may come from third parties and does not represent the views or opinions of Gate. The content displayed on this page is for reference only and does not constitute any financial, investment, or legal advice. Gate does not guarantee the accuracy or completeness of the information and shall not be liable for any losses arising from the use of this information. Virtual asset investments carry high risks and are subject to significant price volatility. You may lose all of your invested principal. Please fully understand the relevant risks and make prudent decisions based on your own financial situation and risk tolerance. For details, please refer to
Disclaimer.
Related Articles
SOL price is positioned in the $92-95 range, with the market in a recovery phase.
Gate News update: On March 19th, Solana (SOL) price is currently trading in the $92-95 range. Recent price movements indicate that the market is in a recovery phase, with prices fluctuating within this range.
GateNews11m ago
River (RIVER) Weekly Gains Hit 50%, Market Divided on Future Outlook
River (RIVER) token's price has risen by 50% in the last week, leading to mixed opinions; some analysts foresee a potential rise above $50, while others advise traders to remain cautious.
GateNews1h ago
Solana Treasury Forward Industries Uses Loan to Buy Back Shares After 89% Price Dive
In brief
Forward Industries purchased more than 6 million of its shares from an institutional investor for $27.4 million as part of a share buyback.
The firm used a $40 million crypto-backed loan from Galaxy Digital to fund the repurchase.
Shares in the firm (FWDI) finished the day
Decrypt1h ago
Mega Bank Global Stablecoin Test vs. Traditional Remittance: Who Wins? Rui-Bin Dong: 200,000 TWD is the "Turning Point"
Mega Bank's field test report shows that stablecoins outperform traditional banks in small remittances, with faster settlement and lower costs; however, traditional banks still have clear advantages in large corporate transfers and compliance. Chairman Tung Jui-pin emphasized that the two should be complementary rather than replace each other. The widespread adoption of stablecoins faces regulatory challenges.
動區BlockTempo2h ago
BTC rises 0.77% in 15 minutes: rebound driven by active buyers overlapping with safe-haven fund resonance
From 2026-03-19 19:00 to 19:15 (UTC), BTC price fluctuated within the range of 69802.0 to 70547.9 USDT, with volatility reaching 1.07%, recording a return rate of +0.77%. Short-term trading activity drove increased market attention, with volatility strength exceeding the daily average, attracting rapid capital participation.
The main driver of this price movement was concentrated active buy orders in the spot market, pushing BTC price up sharply in the short term. On-chain data shows that transfer volume during the 19:00-19:15 interval exhibited no extreme changes, and there were no large whale transfers. Weighing spot market and
GateNews2h ago
Ethereum Continues to Recover, Analysts Discuss Whether It Can Return to $4000 in Q2
Gate News reported that on March 19, Ethereum (ETH) continues to recover following recent market volatility. Analysts are discussing whether Ethereum can climb back to the $4,000 mark in Q2 2026.
GateNews2h ago
