
Key Takeaways
-
AAVE is trading near $173 after a healthy pullback, while still maintaining a strong weekly uptrend.
-
The 4-hour chart shows a clear ascending channel, signaling sustained bullish structure.
-
The 50-period moving average around $171 is acting as key short-term support.
-
A breakdown below support could lead to a dip toward $166, still within bullish structure.
-
A confirmed breakout above $180–$186 may open the door for a move toward $200+.
As of January 18, 2026, Aave (AAVE) is trading around $173.34, posting a mild 0.97% dip over the last 24 hours. Despite the short-term pullback, the broader picture remains constructive, with AAVE still up 4.22% over the past week. This steady recovery signals renewed buyer interest after a prolonged consolidation phase, keeping Aave firmly in focus among top DeFi tokens.
With a market capitalization near $2.65 billion, Aave continues to stand out as one of the most resilient decentralized lending protocols. More importantly, the chart structure is now hinting that a larger move could be brewing beneath the surface.
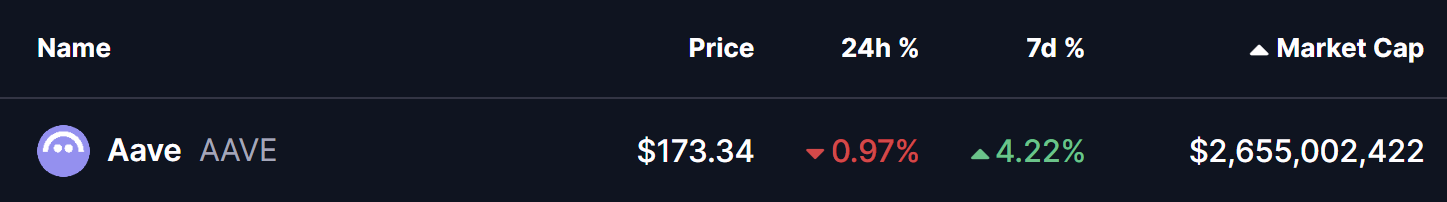
Source: Coinmarketcap
Ascending Channel Structure Emerges
On the 4-hour timeframe, AAVE is respecting a well-defined ascending channel, a bullish pattern characterized by a sequence of higher highs and higher lows. Price action has consistently bounced from the lower boundary of the channel, indicating that buyers are stepping in on dips rather than waiting for deeper pullbacks.
Recently, AAVE faced rejection near the upper boundary around $180.43, triggering a short-term retracement. The pullback, however, has been orderly rather than impulsive, with price now hovering just above the 50-period moving average near $171.09, which is acting as immediate dynamic support.
This behavior suggests healthy consolidation rather than trend exhaustion, keeping the bullish channel structure intact for now.
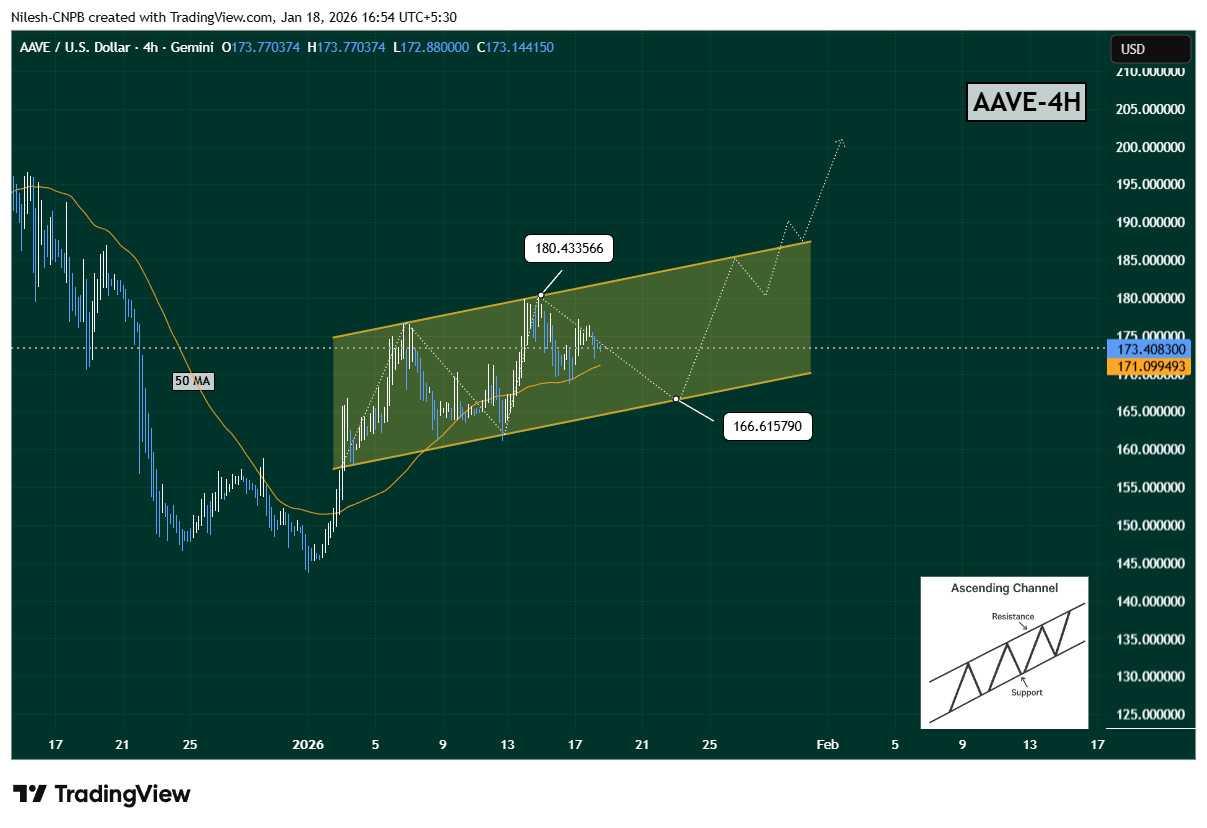
AAVE 4H Chart/Coinsprobe (Source: Tradingview)
What’s Next for AAVE?
If AAVE fails to hold the 50 MA, the next likely downside test sits near the lower boundary of the ascending channel around $166.61, representing a potential 4% downside from current levels. A move into this zone would still be considered a normal corrective pullback within the broader bullish structure.
Then a strong bounce from channel support could send AAVE back toward the upper boundary around $180–$186 resistance zone. A clean breakout above this region would signal strength returning to buyers and could open the door for an accelerated move toward the psychological $200 level and beyond.
That said, patience is key. A confirmed breakout above channel resistance would provide much stronger validation than anticipation alone.
Bottom Line
Aave is quietly building a bullish continuation setup after months of sideways action. The ascending channel on the 4-hour chart highlights steady accumulation, with buyers defending key support levels.
If AAVE rebounds from channel support, a retest of $180–$186 looks likely — and a breakout there could quickly shift momentum toward the $200+ zone. Until then, the current consolidation remains a critical phase that could define AAVE’s next major move.
All eyes are now on how price reacts around support — because the next bounce may determine whether bulls take full control heading into next week.
Disclaimer: The views and analysis presented in this article are for informational purposes only and reflect the author’s perspective, not financial advice. Technical patterns and indicators discussed are subject to market volatility and may or may not yield the anticipated results. Investors are advised to exercise caution, conduct independent research, and make decisions aligned with their individual risk tolerance.
About Author: Nilesh Hembade is the Founder and Lead Author of Coinsprobe, with over 5 years of experience in the cryptocurrency and blockchain industry. Since launching Coinsprobe in 2023, he has been providing daily, research-driven insights through in-depth market analysis, on-chain data, and technical research.
Disclaimer: The information on this page may come from third parties and does not represent the views or opinions of Gate. The content displayed on this page is for reference only and does not constitute any financial, investment, or legal advice. Gate does not guarantee the accuracy or completeness of the information and shall not be liable for any losses arising from the use of this information. Virtual asset investments carry high risks and are subject to significant price volatility. You may lose all of your invested principal. Please fully understand the relevant risks and make prudent decisions based on your own financial situation and risk tolerance. For details, please refer to
Disclaimer.
Related Articles
The RWA Yield Infrastructure Trade
The essay highlights challenges in direct RWA token exposure, emphasizes the potential in leverage opportunities amid settlement delays, critiques Morpho's governance token structure, and presents Fluid as a more effective token model with stablecoin links.
CoinDesk2m ago
Trump's Easing Signals Trigger $2 Trillion Market Revaluation, Bitcoin Surges in Sync
US President Trump announced online progress in US-Iran talks and postponed strikes against Iran. Following the announcement, the S&P 500 index surged, crude oil fell sharply, and Bitcoin rose in tandem. Market reaction demonstrated high correlation across asset classes. A $1.5 billion futures order drew attention, but there is no evidence of insider trading involvement. This incident revealed the rapid repricing of global markets in response to geopolitical news.
MarketWhisper1h ago
Pi Network Weekly Drop 6%, Bullish RSI Meets Billion-Token Unlock Pressure
Pi Network has recently faced price declines, but technical indicators such as RSI approaching oversold levels and community sentiment remaining positive. Despite bullish signals, increased exchange reserves and upcoming token unlocks present bearish risks, with potential selling pressure likely to suppress prices. Market conditions require close monitoring.
MarketWhisper1h ago
U.S.-Iran War Pause News Caught in Conflicting Reports! Bitcoin Surges Back to $70K, But Analysts Warn of Bull Trap
The United States announced a pause on military strikes against Iran, causing Bitcoin to briefly break through $70,000. Analysts warn that this rally could be a bull trap, predicting Bitcoin may retest $46,000. Market sentiment remains subdued due to geopolitical risks and persistent inflation. Trump faces challenges from Iran and dollar-denominated oil prices amid internal pressure.
CryptoCity1h ago
