
**Date: **Mon, Jan 05, 2026 | 10:58 AM GMT
As 2026 kicks off, the broader cryptocurrency market is showing renewed stability. Both Bitcoin (BTC) and Ethereum (ETH) are up more than 6% on the week, and improving sentiment is gradually spreading across major altcoins — including the DeFi heavyweight Aave (AAVE).
AAVE has gained over 8% on a weekly basis, but the more important story is unfolding beneath the surface. While short-term strength is encouraging, the bigger development lies in the broader market structure forming on the higher timeframe. Recent price action suggests a meaningful shift in behavior — one that could mark the early stages of a bullish continuation if key technical levels hold.
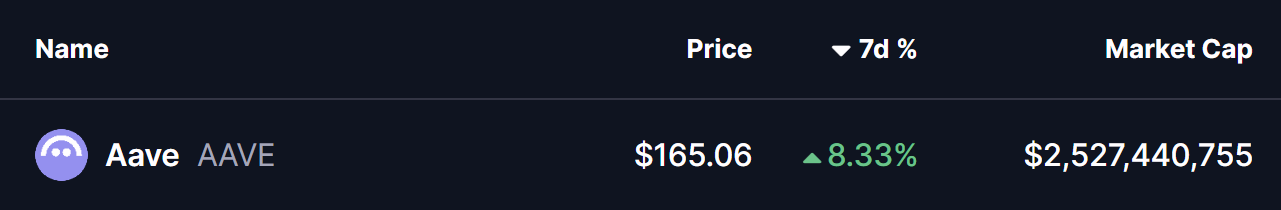
Source: Coinmarketcap
Symmetrical Triangle in Play
On the weekly chart, **AAVE **continues to trade within a symmetrical triangle, a neutral yet powerful pattern that often precedes a major volatility expansion once price approaches its apex.
The structure began forming after AAVE’s strong rally earlier in 2025. However, in August 2025, price faced firm rejection near the triangle’s descending resistance around $385, triggering a sharp corrective move. That pullback resulted in a 62% decline, eventually driving price down toward the triangle’s ascending support trendline near $143.53 last month.
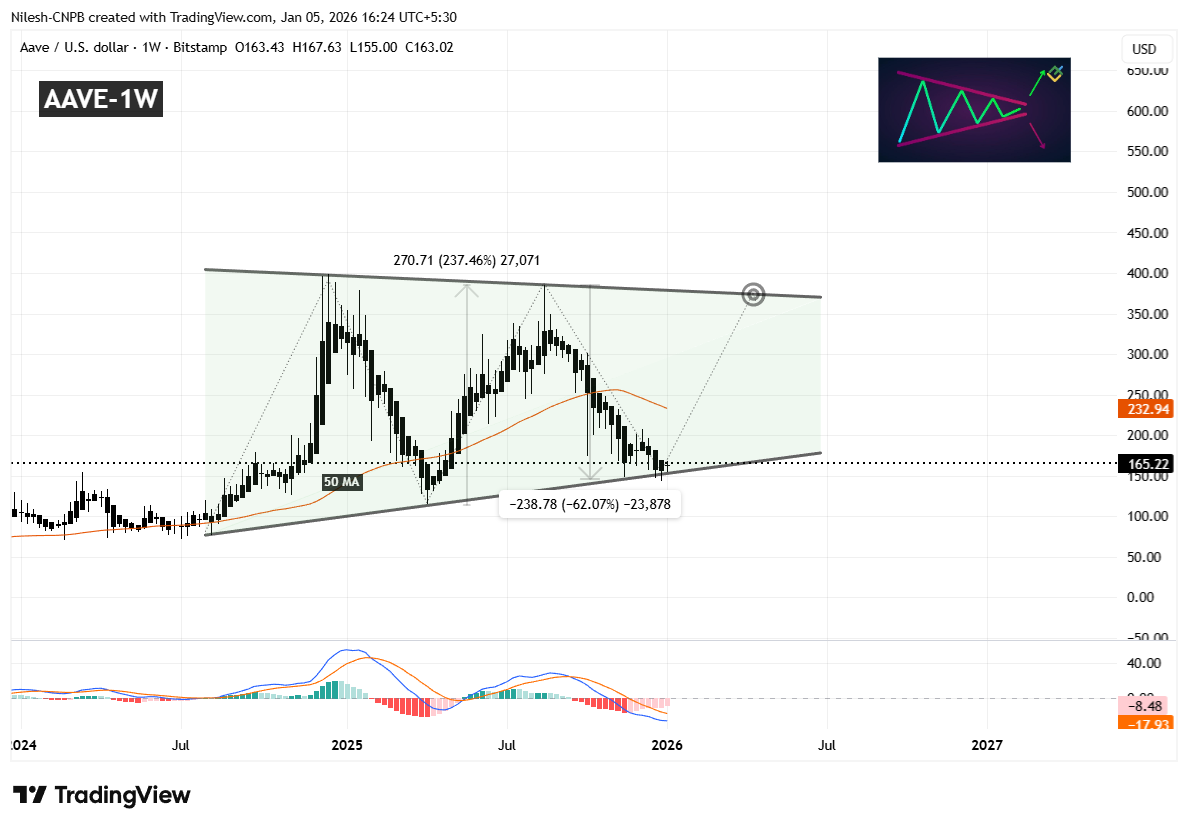
Aave (AAVE) Weekly Chart/Coinsprobe (Source: Tradingview)
Crucially, buyers once again stepped in to defend this long-term support zone. The successful reaction from this level has pushed AAVE back toward the $164 region, signaling renewed buying interest. Notably, this rebound is occurring as the MACD shows early signs of stabilization — a setup that closely resembles conditions seen before AAVE’s previous 237% rally in April 2025.
The next major technical hurdle lies at the 50-week moving average, currently positioned near $232.94. This level has acted as dynamic resistance during the recent decline, and reclaiming it would mark a meaningful shift in medium-term momentum.
What’s Next for AAVE?
If the pattern continues to develop as expected, AAVE could soon attempt a sustained move above the 50-week MA. A confirmed reclaim of this level — followed by acceptance above it — would strengthen the bullish case and increase the probability of a move toward the upper boundary of the triangle near $375.
Such a move would imply a potential upside of roughly 125% from current levels, assuming broader market conditions remain supportive and momentum continues to build.
Until then, patience remains key. Holding above the ascending support trendline is essential for preserving the bullish structure. Any sustained breakdown below this level would weaken the setup and delay the breakout thesis.
For now, the chart suggests AAVE is at a critical inflection point, where compression within the triangle could soon give way to a decisive move — with the direction likely defined by how price behaves around the 50-week moving average.
Disclaimer: The views and analysis presented in this article are for informational purposes only and reflect the author’s perspective, not financial advice. Technical patterns and indicators discussed are subject to market volatility and may or may not yield the anticipated results. Investors are advised to exercise caution, conduct independent research, and make decisions aligned with their individual risk tolerance.
About Author: Nilesh Hembade is the Founder and Lead Author of Coinsprobe, with over 5 years of experience in the cryptocurrency and blockchain industry. Since launching Coinsprobe in 2023, he has been providing daily, research-driven insights through in-depth market analysis, on-chain data, and technical research.
Disclaimer: The information on this page may come from third parties and does not represent the views or opinions of Gate. The content displayed on this page is for reference only and does not constitute any financial, investment, or legal advice. Gate does not guarantee the accuracy or completeness of the information and shall not be liable for any losses arising from the use of this information. Virtual asset investments carry high risks and are subject to significant price volatility. You may lose all of your invested principal. Please fully understand the relevant risks and make prudent decisions based on your own financial situation and risk tolerance. For details, please refer to
Disclaimer.
Gerelateerde artikelen
Zcash Price Jumps 12% as Demand Drives Push Toward $400
Key Insights
Zcash surged nearly 12 percent, rebounding from $300 support as renewed buying interest pushed the price toward the $360 level during Friday’s trading session.
Increased demand for privacy coins and rising shielded pool usage reduced liquid supply, supporting stronger price
CryptoNewsLand19m geleden
Zcash Price Jumps 12% as Demand Drives Push Toward $400
Key Insights
Zcash surged nearly 12 percent, rebounding from $300 support as renewed buying interest pushed the price toward the $360 level during Friday’s trading session.
Increased demand for privacy coins and rising shielded pool usage reduced liquid supply, supporting stronger price
CryptoNewsLand23m geleden
PEPE Price Feeds Collapse as Volume Stays Active Across Markets
Key Insights:
PEPE price feeds show zero values across indicators while trading volume remains active, creating a disconnect between market activity and visible data.
Momentum indicators like RSI and MACD continue updating, but they lack relevance due to missing price data and broken chart s
CryptoNewsLand28m geleden
PEPE Price Feeds Collapse as Volume Stays Active Across Markets
Key Insights:
PEPE price feeds show zero values across indicators while trading volume remains active, creating a disconnect between market activity and visible data.
Momentum indicators like RSI and MACD continue updating, but they lack relevance due to missing price data and broken chart s
CryptoNewsLand29m geleden
Dogecoin Price Holds Tight Range as Breakout Pressure Builds
Key Insights
Dogecoin trades between $0.09 and $0.10 as buyers defend support and sellers cap rallies, creating a sustained consolidation structure across sessions.
Momentum indicators improve gradually while remaining below overbought levels, indicating room for further upside movement
CryptoNewsLand1u geleden
XRP Price Compresses Near $1.45 as Inflows Rise and Signals Diverge
Key Insights:
XRP trades within a rising wedge as price compression continues, while steady ETF inflows and declining exchange reserves reflect sustained accumulation pressure.
Short-term momentum remains supported by a bullish MACD crossover, even as the broader pattern structure suggests a
CryptoNewsLand2u geleden