Key Takeaways
-
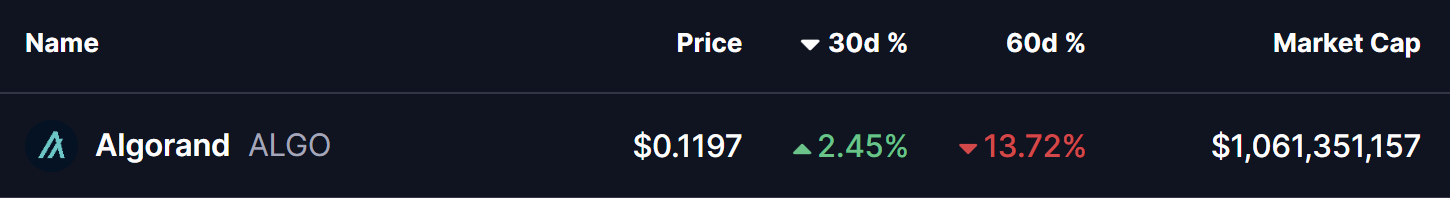
Algorand (ALGO) is consolidating after a 13% decline over the past 60 days, while showing stabilization in the last month.
-
The daily chart reveals a repeating bullish fractal, similar to the setup that triggered ALGO’s 300% rally in November 2024.
-
Price is holding inside a long-term accumulation zone between $0.11 and $0.1530.
-
The 200-day moving average near $0.1912 is acting as key resistance and breakout confirmation level.
-
A successful reclaim of the 200 MA could open the path toward $0.60 and the ascending resistance trendline, while a drop below $0.11 would invalidate the bullish setup.
ALGO, the native token of Algorand’s Layer-1 blockchain, has shown steady but muted momentum over the past 30 days, helping slow down its broader correction. Despite this stabilization, ALGO remains down more than 13% over the last 60 days, keeping sentiment cautious across the market.
That said, when looking beyond short-term price noise, the daily chart is beginning to tell a familiar story. The current structure closely resembles a bullish fractal that, in the past, preceded a powerful breakout rally—raising an important question for traders: is this just consolidation, or a quiet accumulation phase before the next move?
Source: Coinmarketcap
Fractal Setup Hints at a Bullish Reversal
On the daily timeframe, ALGO is displaying early signs of a repeating bullish structure, built around three key technical elements:
-
A rejection from the long-term ascending resistance trendline
-
A prolonged accumulation zone at major historical support
-
A potential reclaim of the 200-day moving average
The current corrective phase began in December 2024, when ALGO was rejected near the ascending resistance trendline around $0.60. That rejection triggered a deep pullback of more than 80%, eventually driving price back into the long-term demand zone between $0.11 and $0.1530—a region that has repeatedly acted as an accumulation area on the chart.
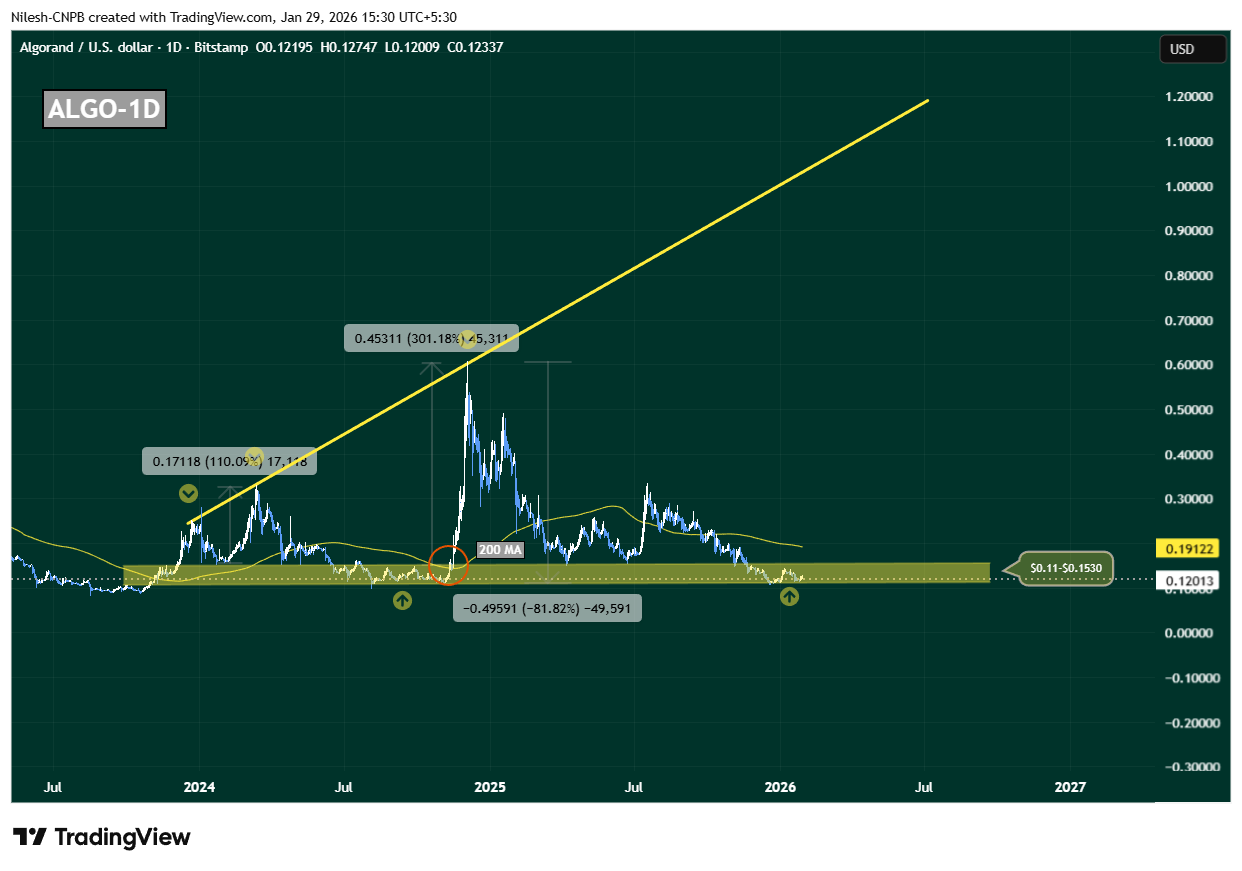
Algorand (ALGO) Daily Chart/Coinsprobe (Source: Tradingview)
This zone is not just technically important; it has also served as a launchpad during previous cycles, where downside momentum stalled and long-term buyers quietly stepped in.
History Rhymes on the ALGO Chart
What makes this setup particularly compelling is how closely it mirrors November 2024’s breakout structure. Back then, ALGO spent extended time consolidating near the same support band before reclaiming the 200-day moving average. Once that level flipped into support, price accelerated sharply—resulting in a 300% rally toward the ascending resistance trendline.
Today, ALGO is once again compressing inside this accumulation range, while the 200-day moving average sits overhead near $0.1912, acting as dynamic resistance. This alignment suggests the market may be approaching another inflection point.
What’s Next for ALGO?
At present, ALGO is hovering near $0.12, firmly inside its long-term accumulation zone. As long as price holds above this region, the broader bullish fractal remains intact.
A clean and sustained reclaim of the 200-day moving average around $0.1912 would be a critical confirmation signal. If bulls manage to flip this level into support, it would closely replicate previous breakout conditions and could trigger a sharp upside expansion. In that scenario, $0.60 becomes a realistic medium-term target, with further upside possible toward the ascending resistance trendline if momentum builds.
However, the structure is not without risk. A decisive breakdown below $0.11 would weaken the accumulation thesis, signal loss of long-term support, and open the door for deeper downside.
For now, ALGO sits at a make-or-break zone. The chart suggests patience is key—but if history repeats, this quiet phase may not last much longer.
Disclaimer: The views and analysis presented in this article are for informational purposes only and reflect the author’s perspective, not financial advice. Technical patterns and indicators discussed are subject to market volatility and may or may not yield the anticipated results. Investors are advised to exercise caution, conduct independent research, and make decisions aligned with their individual risk tolerance.
About Author: Nilesh Hembade is the Founder and Lead Author of Coinsprobe, with over 5 years of experience in the cryptocurrency and blockchain industry. Since launching Coinsprobe in 2023, he has been providing daily, research-driven insights through in-depth market analysis, on-chain data, and technical research.
Disclaimer: The information on this page may come from third parties and does not represent the views or opinions of Gate. The content displayed on this page is for reference only and does not constitute any financial, investment, or legal advice. Gate does not guarantee the accuracy or completeness of the information and shall not be liable for any losses arising from the use of this information. Virtual asset investments carry high risks and are subject to significant price volatility. You may lose all of your invested principal. Please fully understand the relevant risks and make prudent decisions based on your own financial situation and risk tolerance. For details, please refer to
Disclaimer.
Gerelateerde artikelen
Major CEX and DEX Funding Rates Show Market-Wide Bearish Sentiment on May 1
According to Coinglass data, on May 1, major CEX and DEX funding rates show market-wide bearish sentiment following a slight Bitcoin decline. Funding rates below 0.005% indicate bearish positioning, with rates above 0.01% signaling bullish sentiment.
GateNews11m geleden
Delphi Digital Analysis: Bitcoin, Ethereum, and Solana Five-Year Returns Show -13% Worst Case for BTC, 13x Average for ETH
According to Delphi Digital's latest analysis, Bitcoin (BTC), Ethereum (ETH), and Solana (SOL) have yielded positive long-term returns across most five-year holding periods since May 2016, despite significant declines exceeding 50% since October 2025.
The analysis examined all possible five-year ho
GateNews19m geleden
65% of Institutions See CLARITY Act as XRP Catalyst
A Yahoo survey cited by market analyst ChartNerd shows that 65% of institutions view the CLARITY Act as a potential breakout catalyst for XRP, signaling a shift toward regulatory clarity as the primary driver of institutional adoption rather than speculation. The U.S. Securities and Exchange
CryptoFrontier2u geleden
Survey: 70% of Investors See Bitcoin as Undervalued
A global survey conducted by Coinbase and Glassnode found that over 70% of investors believe Bitcoin is currently trading at undervalued levels, according to the survey data. The survey included 91 total respondents comprising 29 institutional investors and 62 individual investors. Institutional inv
CryptoFrontier2u geleden
BTC Confirms Bearish Divergence Signaling Rough Times for Bitcoin and Altcoin Prices
BTC confirms bearish divergence signaling rough times for crypto.
Both Bitcoin (BTC) and altcoins are all expected to crash significantly.
Very small signs for bullish outcomes shine through.
The price of BTC failed to maintain its price above the critical $76,000 price range,
CryptoNewsLand3u geleden
Shiba Inu Whales Accumulate as Open Interest Hits $37M
Shiba Inu is trading at $0.000006261 at the time of writing, with derivatives activity accelerating and large holders positioning for a directional move. The meme coin faces significant macro pressure but shows signals that sophisticated traders expect a breakout, according to the article's technica
CryptoFrontier4u geleden