Futures
Access hundreds of perpetual contracts
TradFi
Gold
One platform for global traditional assets
Options
Hot
Trade European-style vanilla options
Unified Account
Maximize your capital efficiency
Demo Trading
Futures Kickoff
Get prepared for your futures trading
Futures Events
Join events to earn rewards
Demo Trading
Use virtual funds to experience risk-free trading
Launch
CandyDrop
Collect candies to earn airdrops
Launchpool
Quick staking, earn potential new tokens
HODLer Airdrop
Hold GT and get massive airdrops for free
Launchpad
Be early to the next big token project
Alpha Points
Trade on-chain assets and earn airdrops
Futures Points
Earn futures points and claim airdrop rewards
Non-farm payrolls unexpectedly decline, coupled with Middle East conflict, causing US stocks and currencies to fall together. The commodities index hits a historic high, US crude oil surges 16%, and the "Fear Index" VIX soars.
U.S. non-farm employment unexpectedly declines, causing uncertainty in Federal Reserve policy prospects. Middle East conflicts drive oil prices to record weekly gains. The private credit industry faces liquidity shocks. Amid multiple pressures, U.S. stocks and the dollar decline simultaneously within the day, while commodities soar to historic highs.
On Friday, the S&P 500 fell 1.3%, down more than 2% for the week, marking the worst weekly performance since October last year. The Dow and small-cap stocks led the decline, dropping 3-4%.
(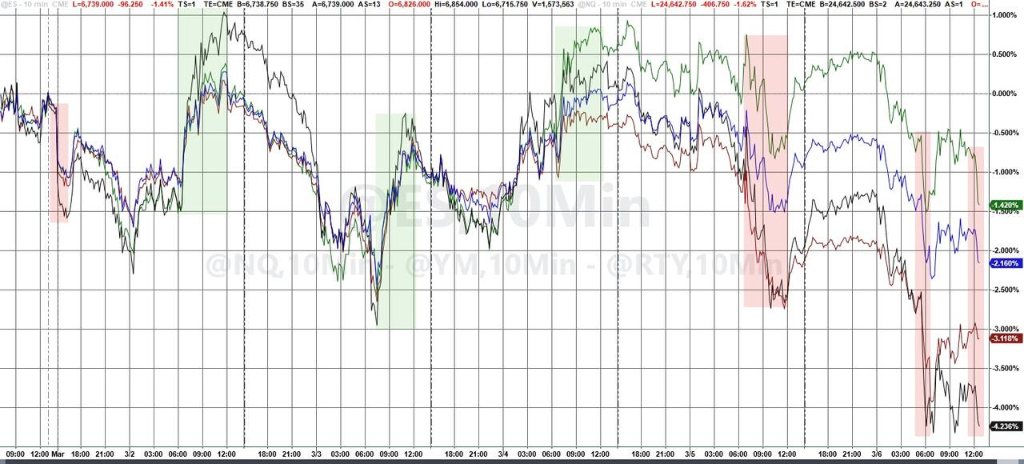 Weekly trend of major U.S. stock indices)
According to Wallstreetcn, U.S. non-farm payrolls in February decreased by 92,000, with employment revisions for the previous two months down by 69,000, the largest decline since the pandemic outbreak. The unemployment rate unexpectedly rose to 4.4%. The sharp drop in data should have fueled expectations of rate cuts, but amid soaring oil prices triggered by Middle East tensions, markets are gripped by fears of stagflation.
Brian Jacobsen of Annex Wealth Management said that negative employment data combined with rising oil prices will make traders worry about stagflation risks. Allen Zeng of Morgan Stanley Wealth Management stated:
Bloomberg strategist Kristine Aquino pointed out that due to Iran-related conflicts pushing oil prices higher, inflation concerns had already overshadowed expectations for further easing to support the economy. However, after Friday’s employment data, growth worries began to divert market attention from inflation.
Goldman Sachs traders noted that the S&P 500 has broken below the key medium-term CTA trend support at 6,762 points, which could trigger more algorithmic selling.
Goldman Sachs assessment indicates that in the coming week, regardless of market direction, CTA strategies tend to sell, with total sell-offs reaching up to $190 billion in a down scenario, including about $63.7 billion in U.S. stocks.
(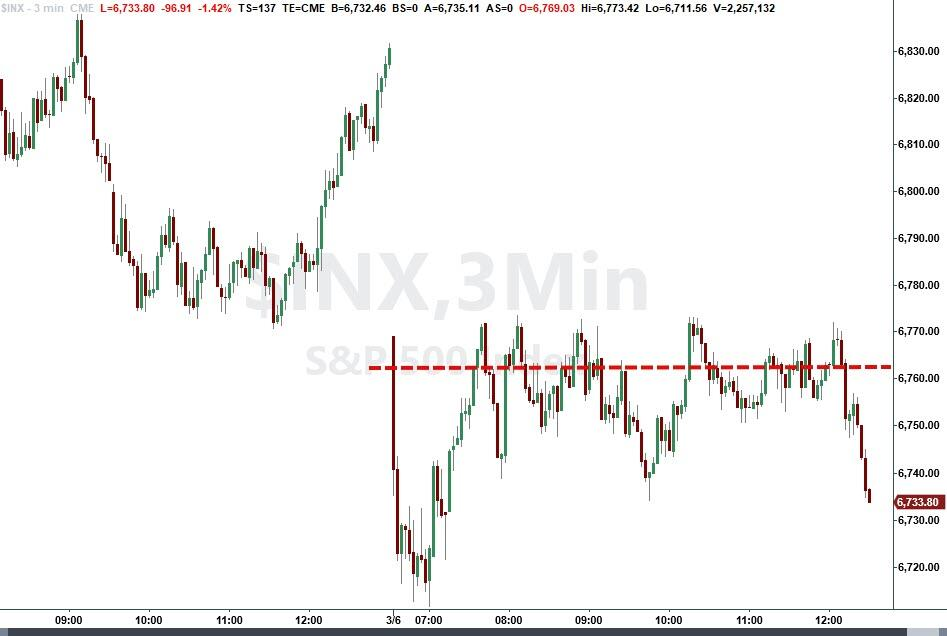 S&P 500 breaks key support at 6762 points)
Financial stocks led the decline due to turmoil in the private credit market, with BlackRock plunging 7.7%. Wallstreetcn mentioned that Oracle and OpenAI canceled plans to expand AI data centers in Texas, causing chip manufacturers’ stocks to plummet.
(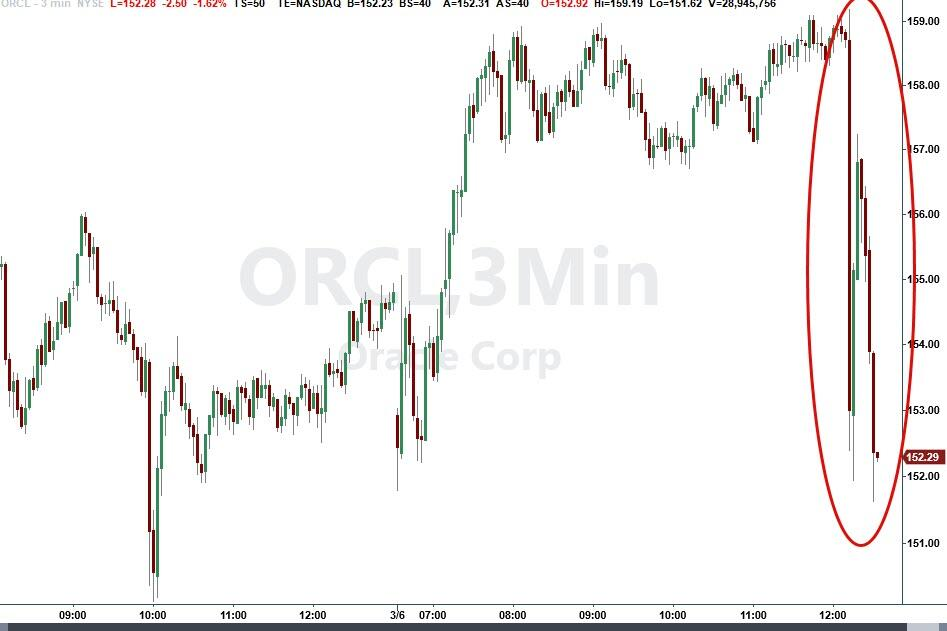 Oracle intraday down 1.11%)
Despite all seven tech giants falling on Friday, their overall performance this week outperformed the other 493 components of the S&P 500.
(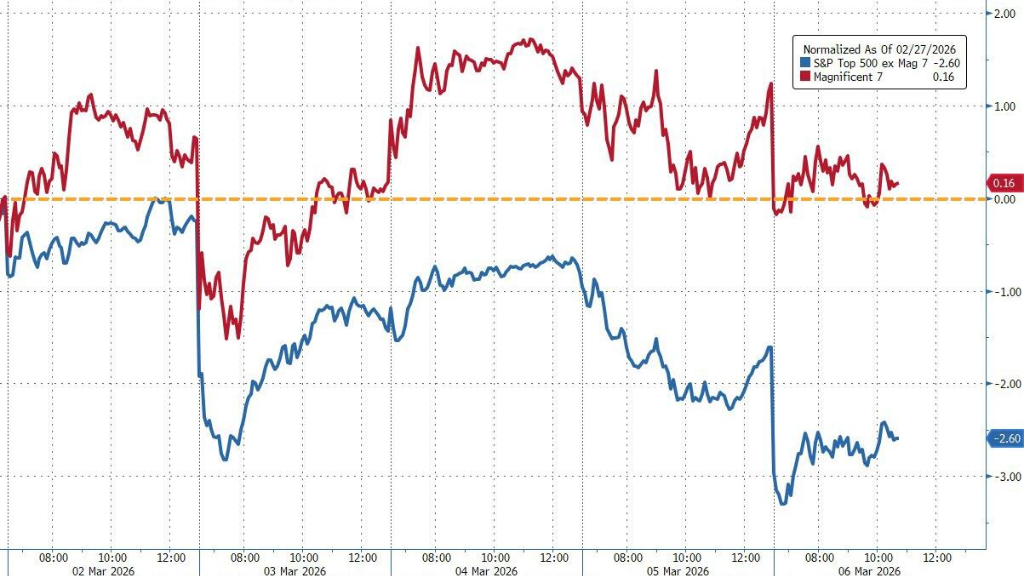 Tech giants outperform the rest of the S&P 500 this week)
In sector performance this week, energy led gains, while materials lagged due to global recession fears and declining profit margins.
(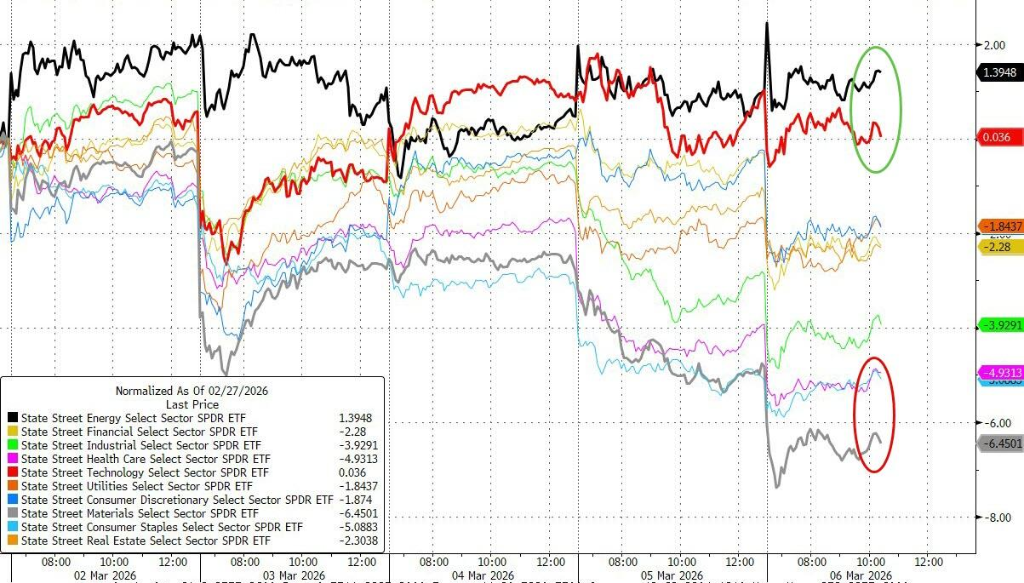 Sector performance of the S&P 500 this week)
WTI crude oil prices continued to surge nearly 16% on Friday, repeatedly breaking through $90 and $91 intraday. The weekly increase totals 35%, the largest weekly gain in history.
(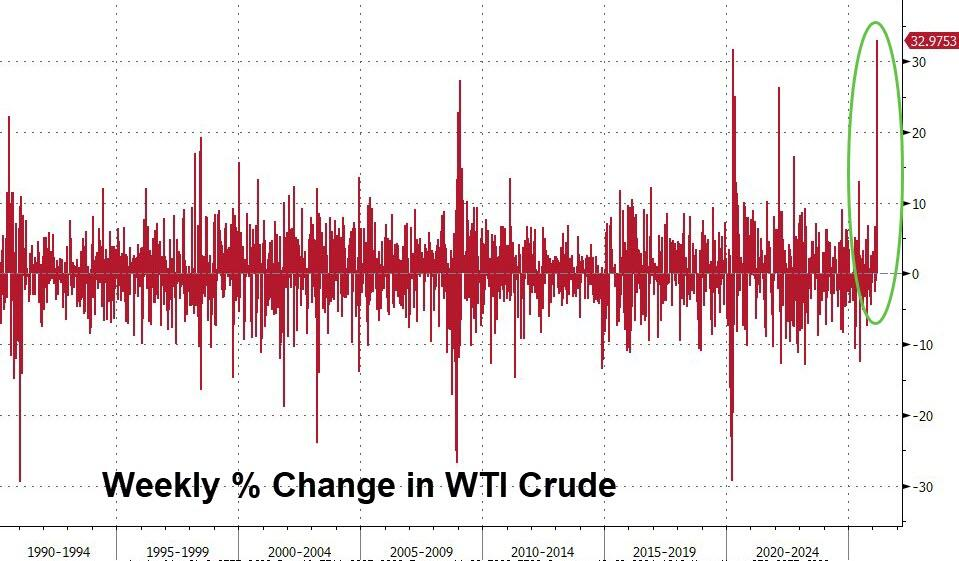 WTI hits record weekly increase)
Commodities rebounded across the board, with Bloomberg’s commodity spot index rising 3.7%, the biggest weekly jump since July 2022, surpassing 701.5756 points, setting a new record high.
NY natural gas futures rose over 5.6%, up more than 9% for the week. EU natural gas prices fared worse, surging over 100% at one point this week.
(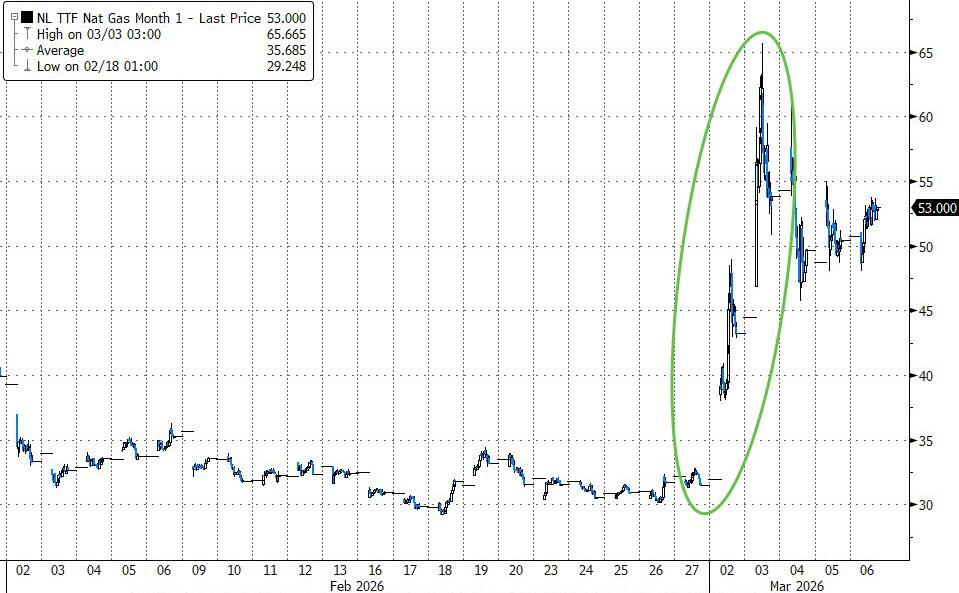 EU natural gas prices doubled at one point this week)
Bloomberg strategist Tatiana Darie summarized major geopolitical events impacting oil prices since 1990, noting that as energy costs rise, the correlation between stocks and oil tends to shift from positive to negative. Currently, this correlation shift is just beginning, and the downward pressure of rising crude prices on risk assets remains in early stages.
After the weak non-farm data, the 10-year U.S. Treasury yield fell about 7 basis points from the daily high, while the 2-year yield once dropped 5 basis points.
(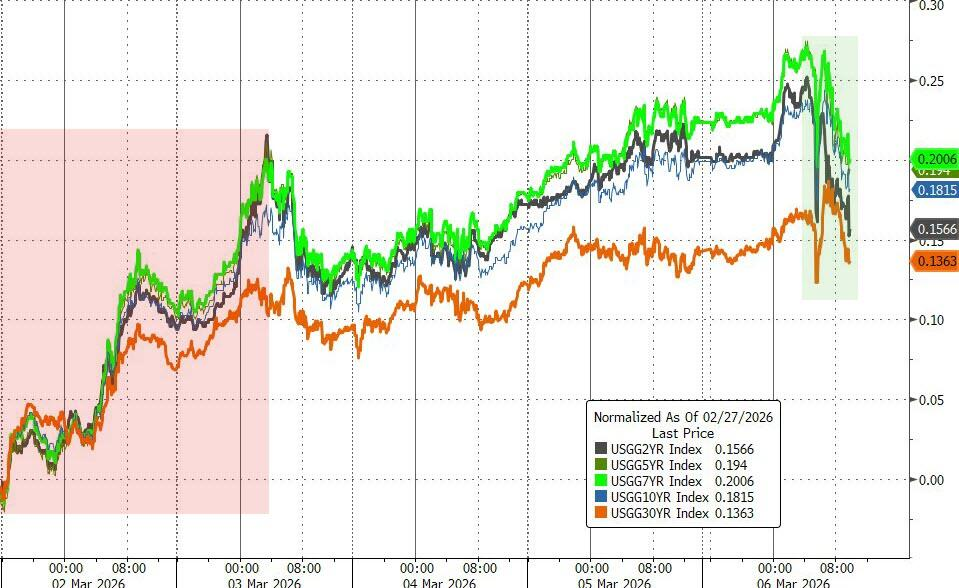 Performance of major U.S. Treasury yields this week)
The dollar index declined 0.34 intraday but still gained over 1% for the week, marking the best weekly performance since October 2024. Bitcoin fell 4%, Ethereum down 4.6%, breaking below $2000.
(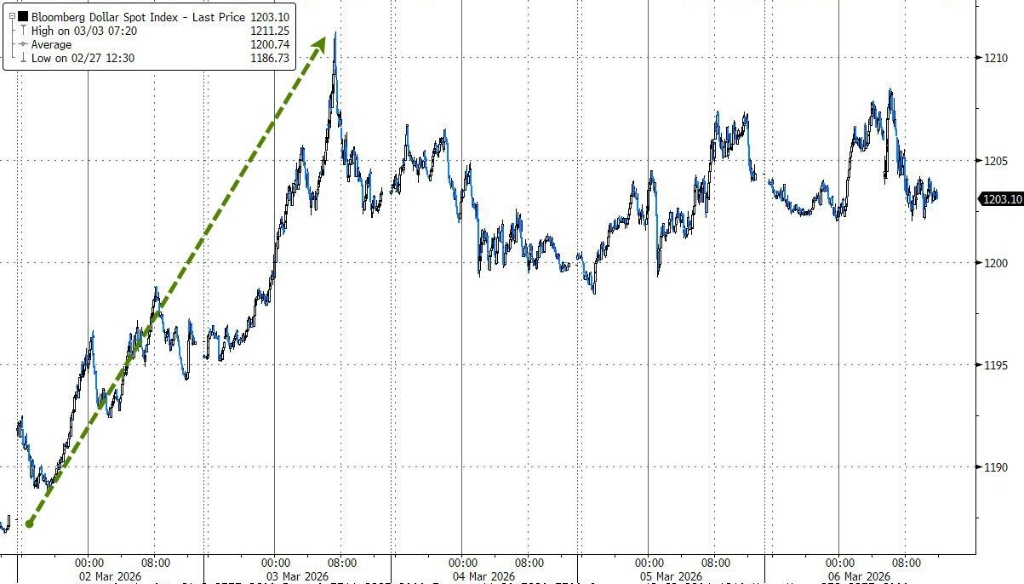 Dollar index)
Safe-haven sentiment pushed spot gold up 1.8%, silver up 2.5%. Due to the dollar’s strength this week, gold fell 2%, ending four consecutive weeks of gains. Silver declined nearly 10% this week.
(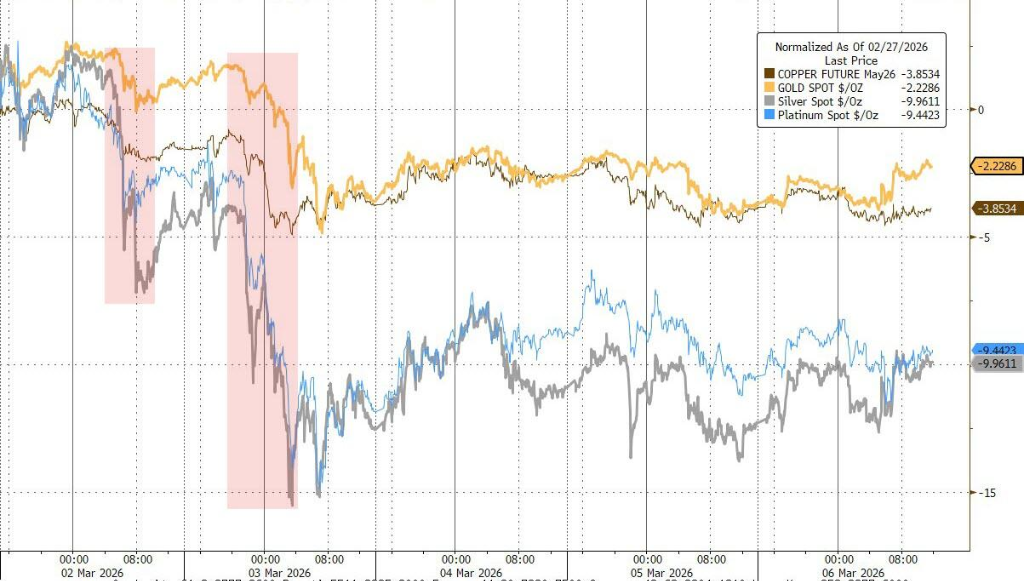 Gold, silver, copper, platinum weekly performance)
On Friday, the S&P 500 dropped 1.3%, down more than 2% for the week, marking the worst weekly performance since October last year. BlackRock plunged 7.7%. Chip stocks tumbled after Oracle and OpenAI canceled Texas expansion plans; Nvidia fell nearly 3%.
( Sector ETFs on March 6)
The Magnificent 7 tech giants:
Chip stocks:
Chinese ADRs:
Other stocks:
European markets declined over 5.5% this week, with auto parts, building materials, banks, and raw materials down over 8%. Germany’s stock market fell 6.7%, Italy’s banking sector down over 9.6%, Norway’s stock market rose over 0.6%.
Country indices:
(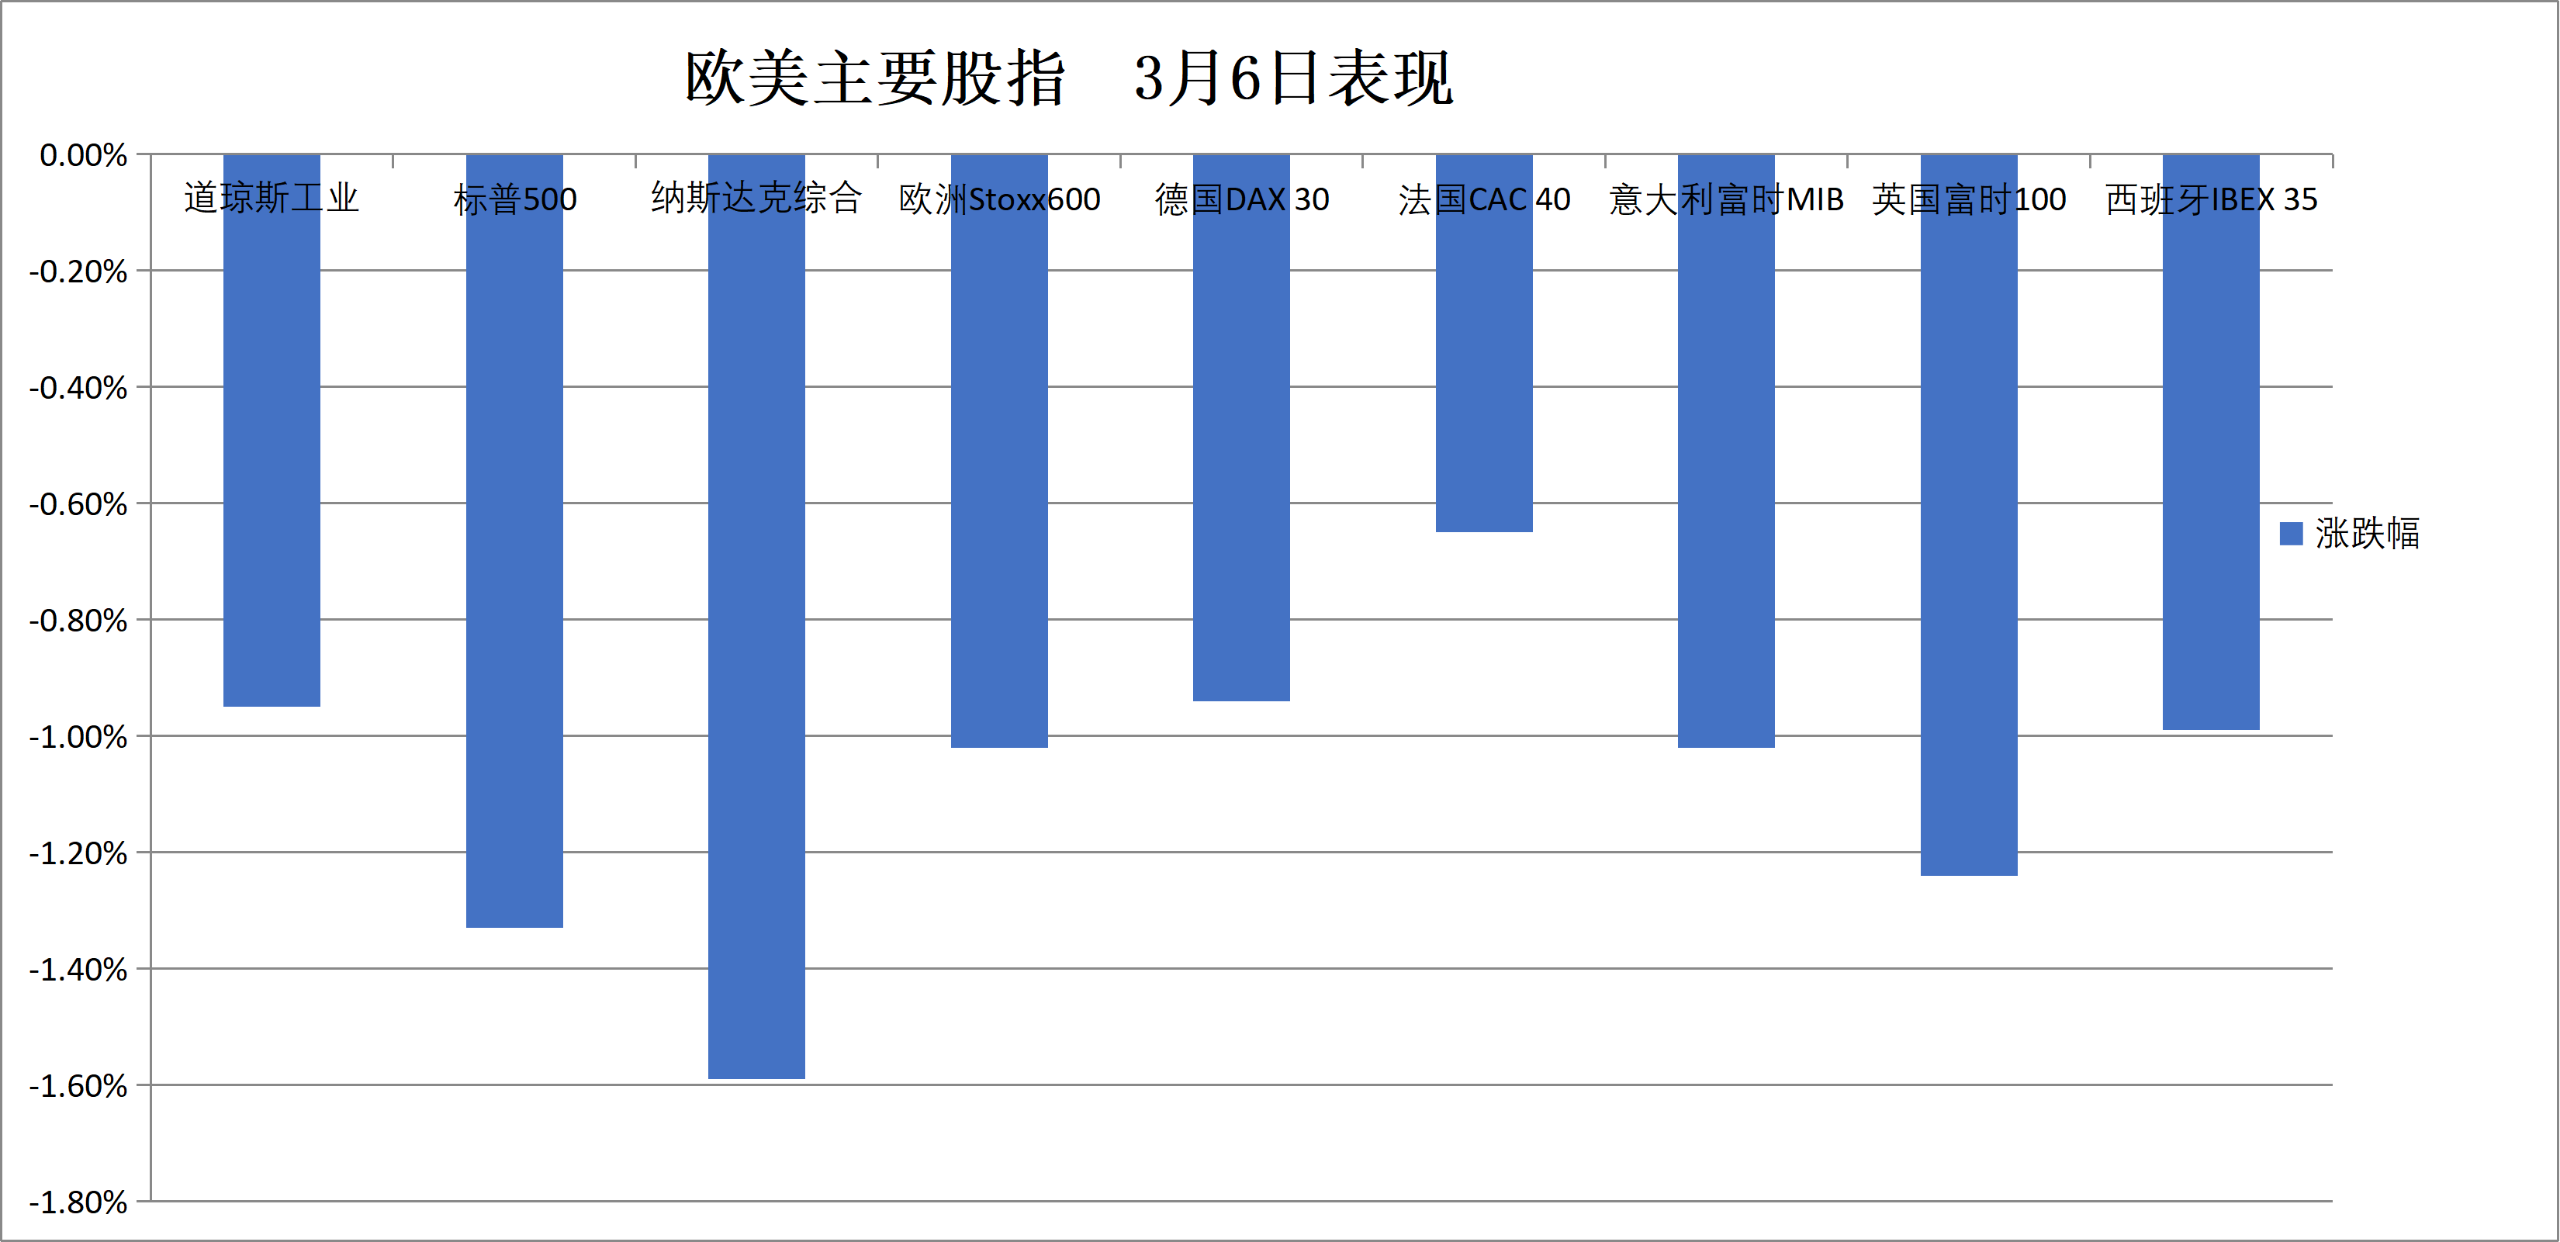 Major European indices on March 6)
Sectors and stocks:
2-year U.S. Treasury real yields fell 15 basis points on non-farm payroll day, while 10-year yields rose 20 basis points this week amid inflation concerns. 2-year German yields rose over 31 basis points, with Middle East tensions fueling inflation worries.
Eurozone bonds:
Dollar index down 0.34%, but weekly gain exceeds 1%, the best since October 2024. Bitcoin down 4%, Ethereum down 4.6%, breaking below $2000.
Non-dollar currencies:
Yen:
Offshore RMB:
Cryptocurrencies:
(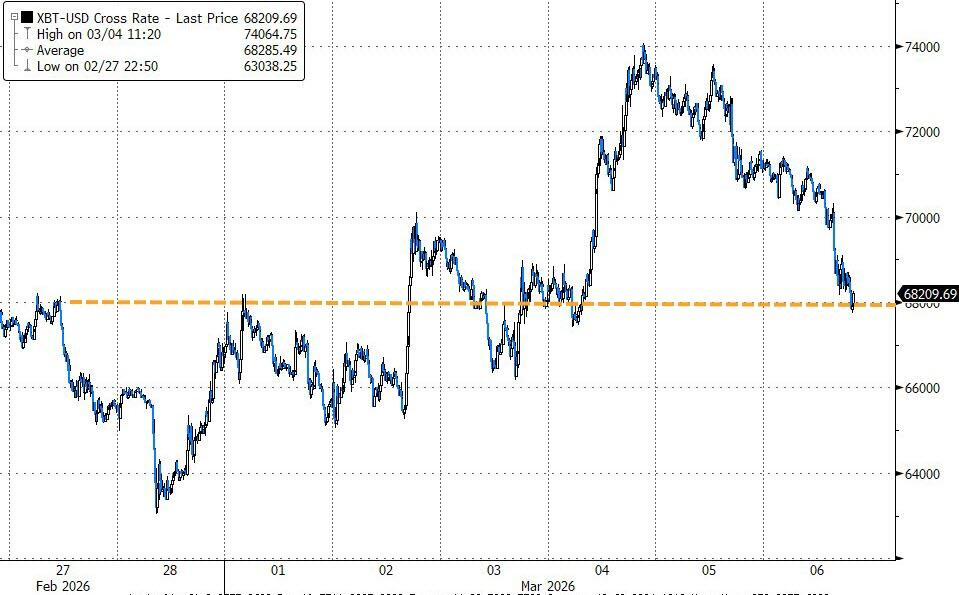 Bitcoin price oscillates upward)
CFTC data (as of March 3 week): Speculators increased net long NYMEX WTI crude oil positions by 10,234 contracts to 108,421 contracts, the highest in about eight months.
Natural Gas:
Safe-haven sentiment pushed spot gold up 1.8%, silver up 2.5%. This week, due to the dollar’s strength, gold fell 2%, ending four weeks of gains. Silver declined nearly 10%.
Silver:
Other metals:
Risk warning and disclaimer
Market risks are present; invest cautiously. This article does not constitute personal investment advice and does not consider individual user’s specific investment goals, financial situation, or needs. Users should determine whether any opinions, views, or conclusions herein are suitable for their circumstances. Investment is at your own risk.