Futures
Access hundreds of perpetual contracts
TradFi
Gold
One platform for global traditional assets
Options
Hot
Trade European-style vanilla options
Unified Account
Maximize your capital efficiency
Demo Trading
Futures Kickoff
Get prepared for your futures trading
Futures Events
Join events to earn rewards
Demo Trading
Use virtual funds to experience risk-free trading
Launch
CandyDrop
Collect candies to earn airdrops
Launchpool
Quick staking, earn potential new tokens
HODLer Airdrop
Hold GT and get massive airdrops for free
Launchpad
Be early to the next big token project
Alpha Points
Trade on-chain assets and earn airdrops
Futures Points
Earn futures points and claim airdrop rewards
Zhang Yaoxi: Geopolitical situation and non-farm data update, gold prices remain volatile or may rebound and strengthen
Zhang Yaoxi: Geopolitical tensions rise again, non-farm data due, gold prices fluctuate or rebound and strengthen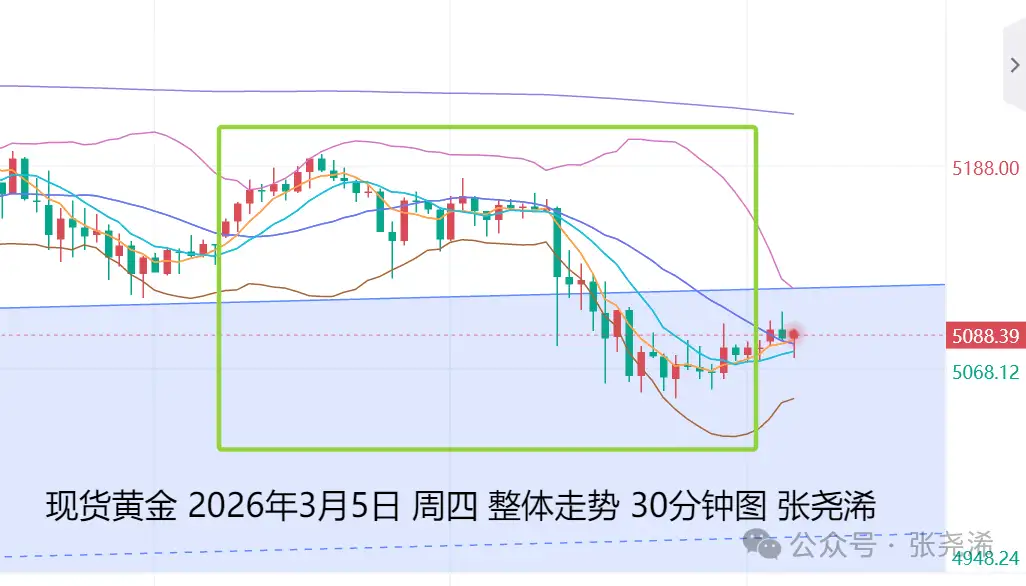
On the previous trading day, Thursday (March 5): International gold faced resistance and declined, recovering some of Wednesday’s gains, and retesting the middle band and other support levels. Although there was some support from buying interest, the trend remained weak until it stabilized above the 5-10 day short-term moving averages. Watch for support near yesterday’s low and around the 60-day moving average for potential long positions.
In terms of specific movement, gold opened at $5145.86 per ounce during Asian hours, initially rebounded, reaching an intraday high of $5194.34 at 11 a.m., then faced resistance and declined. During European trading, it moved sideways, and in the US session, it continued to fall, hitting an intraday low of $5051.35 near the end of the session. It eventually recovered slightly, closing at $5081.03, with a daily range of $142.99. The price fell by $64.83, a 1.26% decline.
In terms of influences, intraday support buying and the escalation of Middle East conflicts increased demand for safe-haven assets, pushing gold to an intraday high. However, resistance and a strengthening dollar, along with US February Challenger job cuts (in thousands) and initial jobless claims for the week ending February 28 (in thousands), were negative for gold, cooling expectations of Fed rate cuts and causing gold to retreat and close lower.
Outlook for today, Friday (March 6): International gold continued its overnight rebound at the open, strengthening initially. The US dollar index was somewhat weak early, providing some support. Additionally, tonight’s US non-farm payroll data is generally bullish for gold, offering some positive sentiment. However, recent ADP and initial jobless claims data have been negative for gold, so the non-farm data may beat expectations but still negatively impact gold.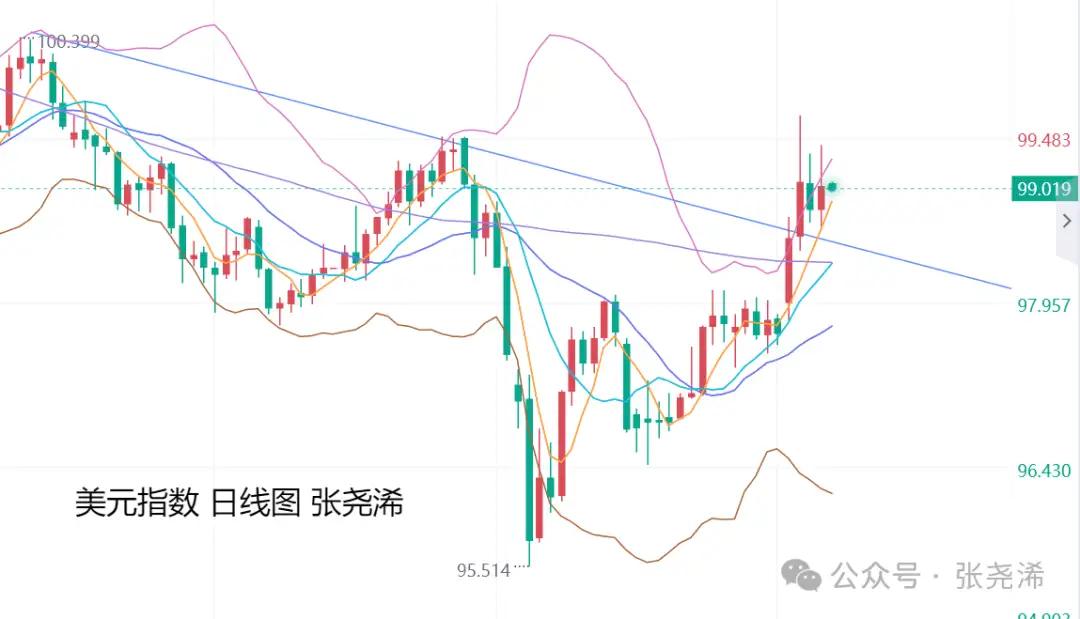
If the non-farm data exceeds or meets expectations, gold may initially fall then rise; if weaker than expected or below previous figures, it may rebound strongly. Otherwise, expect sideways movement or a decline.
In terms of outlook, recent trends have been dominated by US economic data and expectations of rate cuts. After this week, the market will again focus on geopolitical risks, maintaining a somewhat bullish bias.
Although the Middle East situation has entered its sixth day, with intensified military actions by Israel and the US against Iran, concerns about rising oil prices and inflation have increased, weakening expectations of Fed rate cuts. However, this is only a short-term suppression. Rising inflation will eventually boost gold’s commodity attributes and strengthen prices. Additionally, signs of a significant increase in US fiscal deficits and macroeconomic uncertainties continue to support gold’s fundamentals. Therefore, even if new highs are not reached this year, gold is expected to remain volatile at high levels.
Technically, on the monthly chart, gold formed a top reversal pattern in February with a downward tail, and this month has shown a sideways doji top pattern, indicating a likely prolonged wide-range consolidation in the first half of the year. In the second half, there is potential for a rally to revisit highs around $6,000 or even $7,500. However, if prices break below $4,300 and close below that level in the first half, it would signal the end of the bull market, with further declines toward $3,500 or lower, possibly around the $3,000 mark.
On the weekly chart, gold faced resistance and retreated, forming a bearish engulfing pattern. Support levels to watch include the 10-week moving average or the middle band of the Bollinger Bands.
On the daily chart, gold repeatedly encountered resistance at the 5-10 day short-term moving averages, preventing further bullish momentum. It is now retesting support at the middle band and other support levels, indicating that the bears still hold an advantage. Watch the upper and lower trend lines of the previous upward channel for potential bullish entries.
Gold: Support levels around $5,050 or $5,000; resistance levels near $5,140 or $5,180.
Silver: Support levels around $80.30 or $78.70; resistance levels near $84.70 or $86.35.
Note:
Gold TD = (International gold price × exchange rate) / 31.1035
A $1 fluctuation in international gold prices roughly causes a $0.25 change in Gold TD (theoretically).
US futures gold price = London spot price × (1 + gold swap rate × days to expiry / 365)
Follow me to make your gold trading ideas clearer!
Reviewing historical cause and effect, interpreting current environments, and forecasting future trends—adopting bold predictions and cautious trading principles. – Zhang Yaoxi
The above opinions and analyses are solely the author’s personal views, for reference only, not trading advice. Trade at your own risk.
You decide your own money.