BLY vs ARB: The Battle for Dominance in Emerging Blockchain Technologies
Introduction: BLY vs ARB Investment Comparison
In the cryptocurrency market, the comparison between Blocery (BLY) vs Arbitrum (ARB) has been an unavoidable topic for investors. The two not only show significant differences in market cap ranking, application scenarios, and price performance, but also represent different positioning in the crypto asset space.
Blocery (BLY): Since its launch, it has gained market recognition for its focus on recording agricultural food production and distribution information on the blockchain.
Arbitrum (ARB): Introduced as an Ethereum scaling solution, it has been hailed for enabling high-throughput, low-cost smart contracts while maintaining trustless security.
This article will provide a comprehensive analysis of the investment value comparison between BLY and ARB, focusing on historical price trends, supply mechanisms, institutional adoption, technical ecosystems, and future predictions, attempting to answer the question most concerning to investors:
"Which is the better buy right now?"
I. Price History Comparison and Current Market Status
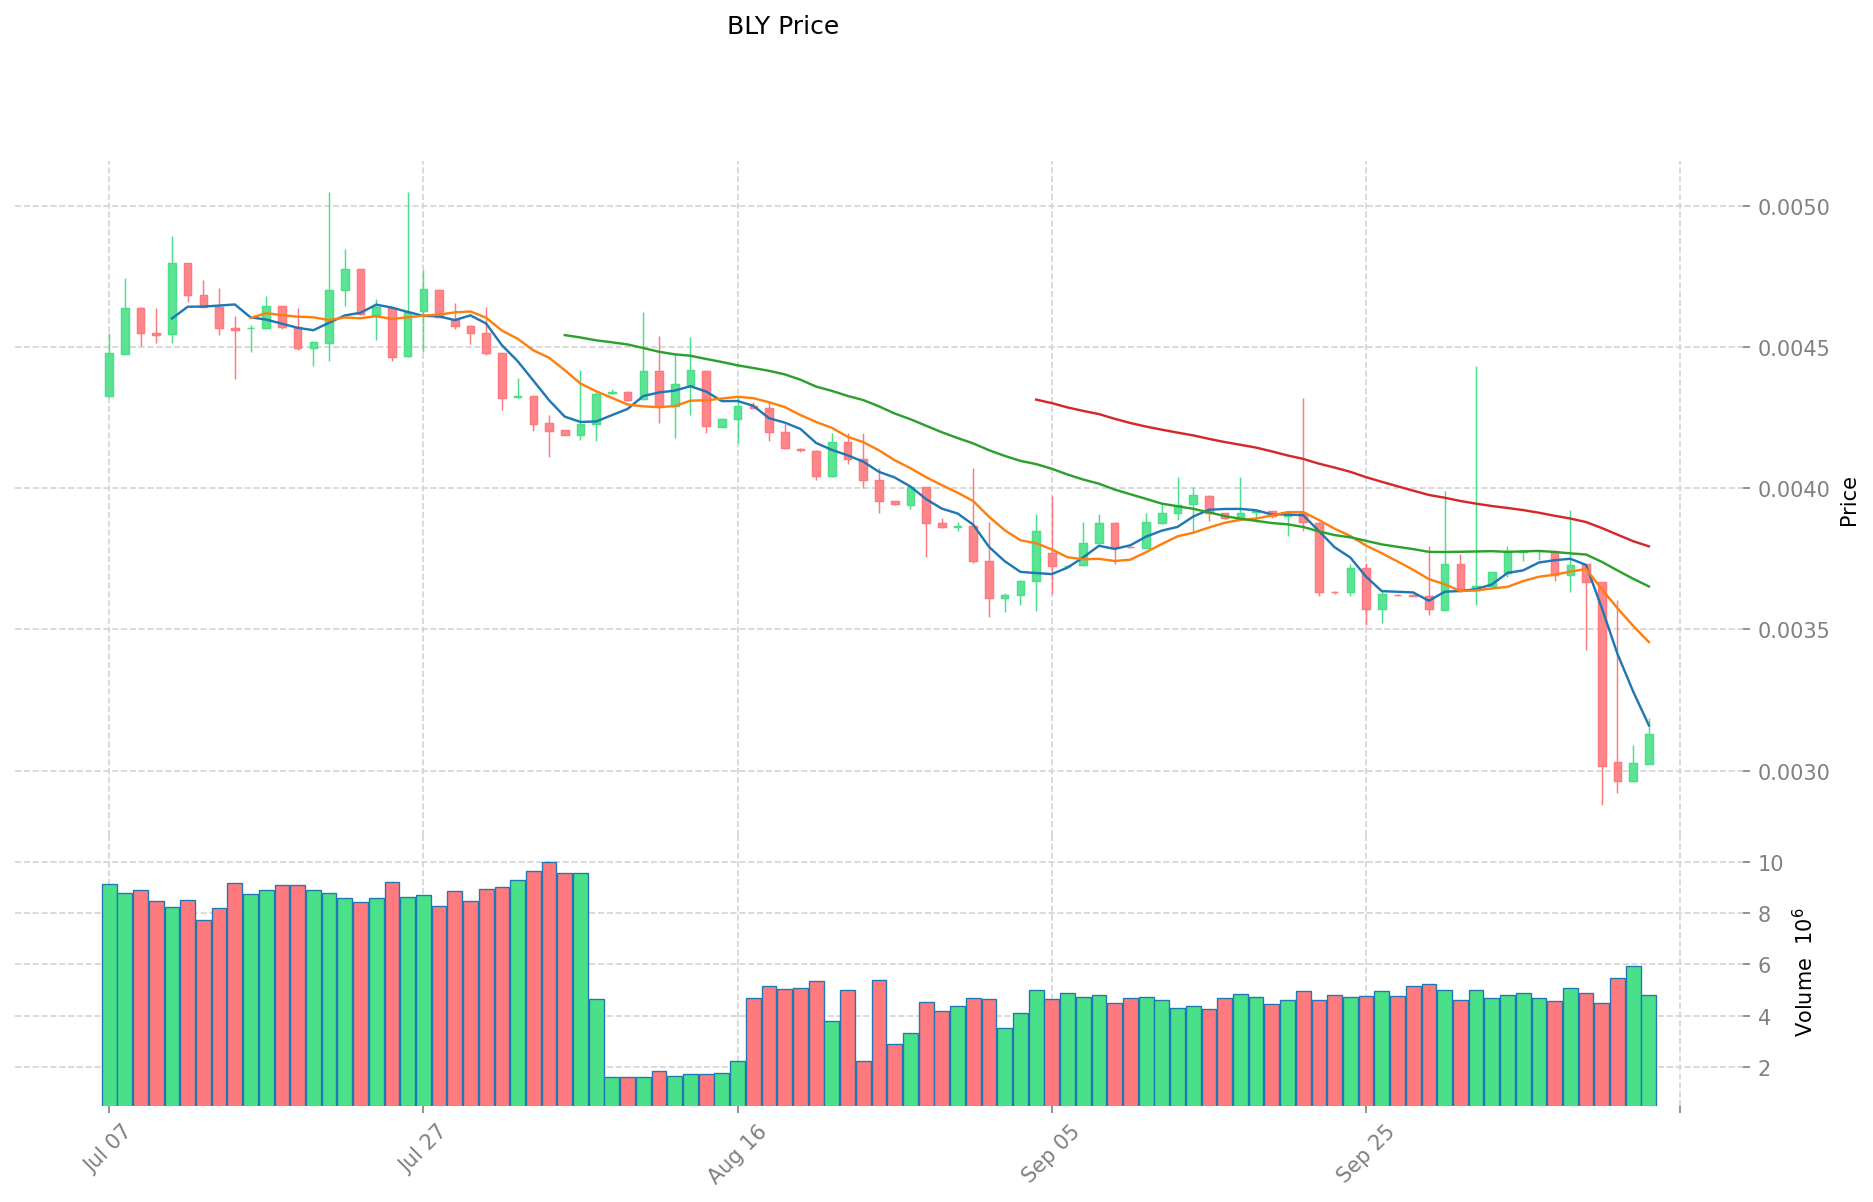
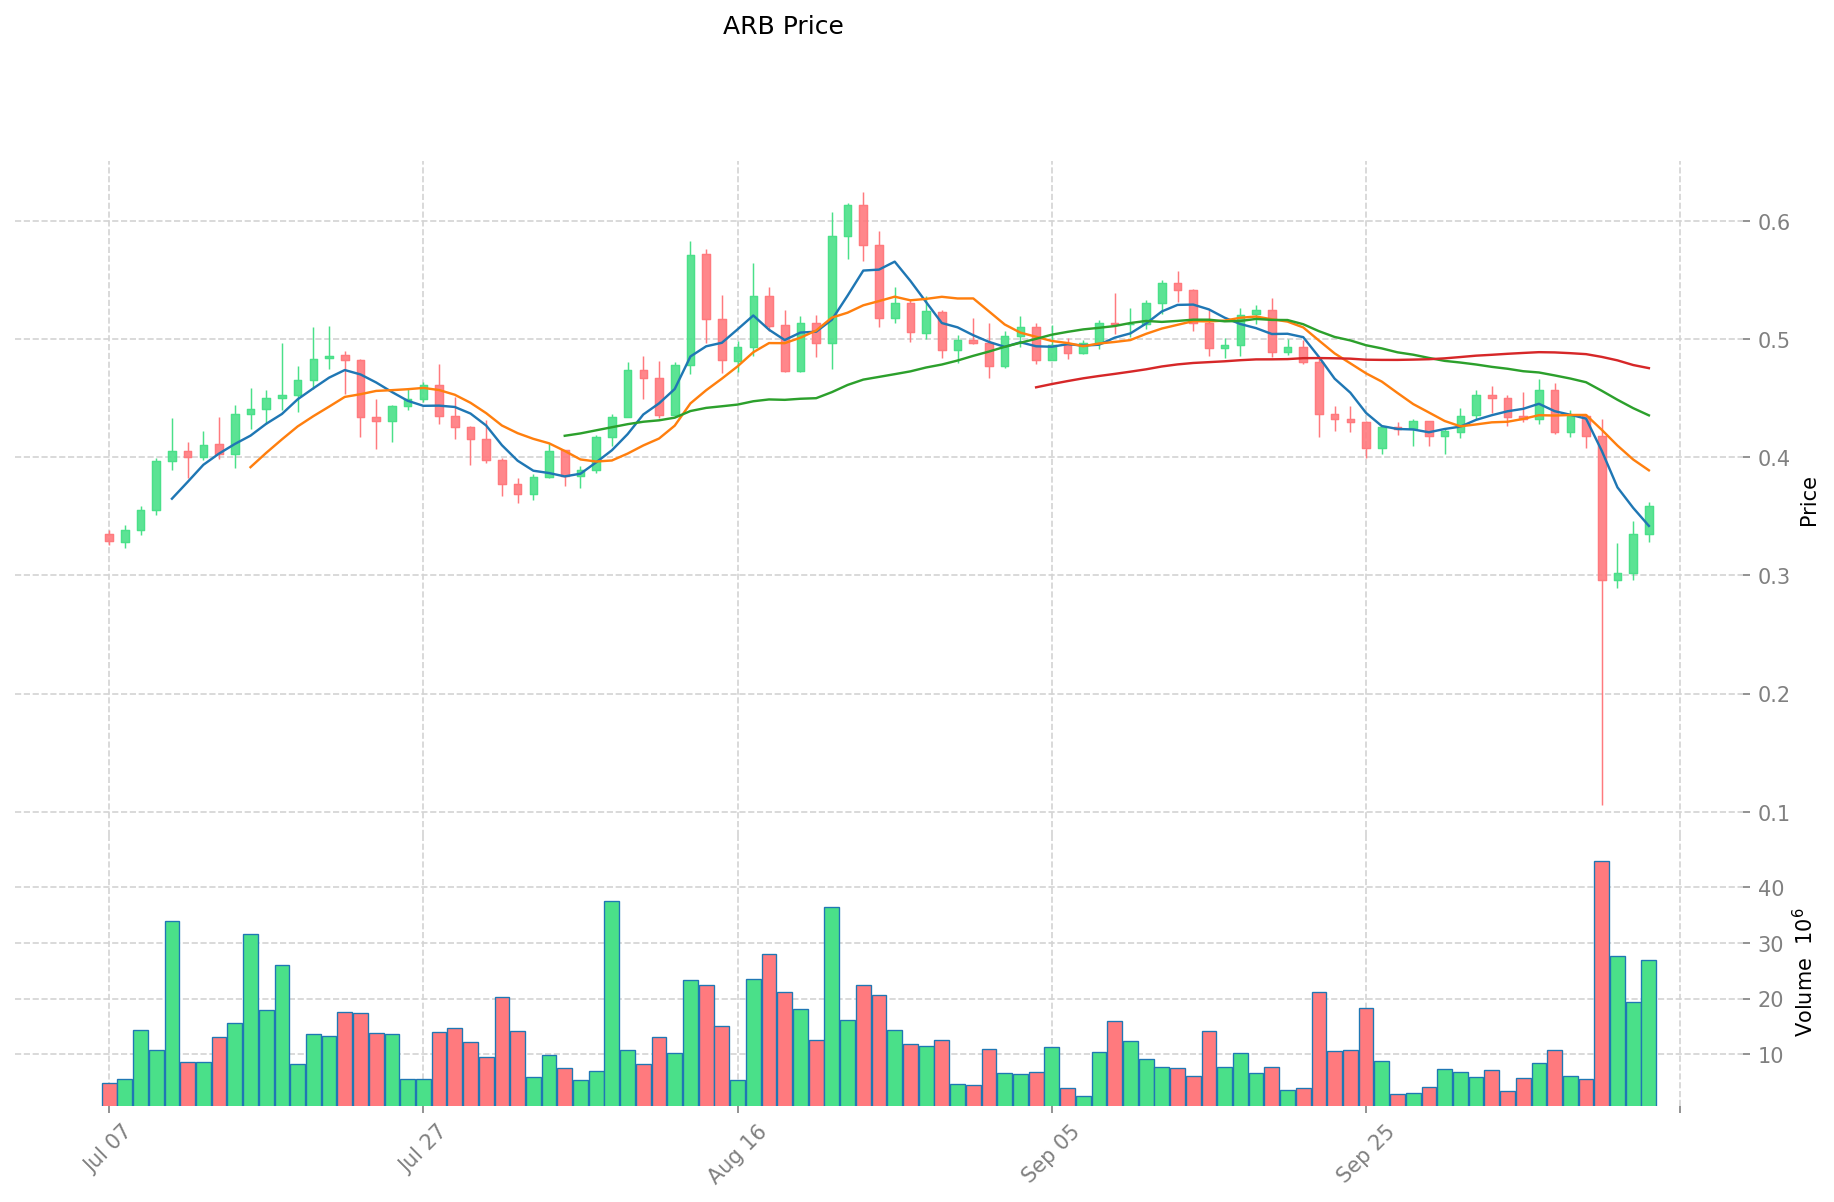
BLY and ARB Historical Price Trends
- 2021: BLY reached its all-time high of $0.724004 on April 5, 2021.
- 2023: ARB reached its all-time high of $4.00 on March 23, 2023, shortly after its launch.
- Comparative analysis: BLY has fallen from its all-time high of $0.724004 to a current price of $0.003129, while ARB has declined from its peak of $4.00 to $0.3583.
Current Market Situation (2025-10-14)
- BLY current price: $0.003129
- ARB current price: $0.3583
- 24-hour trading volume: $14,856.42 (BLY) vs $9,250,737.41 (ARB)
- Market Sentiment Index (Fear & Greed Index): 38 (Fear)
Click to view real-time prices:
- View BLY current price Market Price
- View ARB current price Market Price
II. Core Factors Affecting the Investment Value of BLY vs ARB
Supply Mechanism Comparison (Tokenomics)
- BLY: Fixed maximum supply of 1 billion tokens with 31.3% of tokens distributed through airdrops
- ARB: Total supply of 10 billion tokens with gradual distribution schedule; 42.1% allocated to the community treasury
- 📌 Historical pattern: Fixed supply tokens like BLY tend to create scarcity value while ARB's larger supply with controlled distribution can provide more stability for governance and ecosystem growth.
Institutional Adoption and Market Applications
- Institutional holdings: ARB appears to have stronger institutional backing with significant investments from VC firms like Pantera Capital and Paradigm
- Enterprise adoption: ARB shows broader adoption through Arbitrum's established ecosystem of over 300 applications, while BLY is still developing its market presence
- Regulatory attitudes: Both operate in similar regulatory environments as Layer 2 governance tokens, with ARB having a longer track record of navigating regulatory landscapes
Technical Development and Ecosystem Building
- BLY technical upgrades: Focus on zero-knowledge proofs and EVM compatibility through Blast L2 rollup technology
- ARB technical development: Advanced Arbitrum Orbit and Arbitrum Nova technologies providing established scaling solutions
- Ecosystem comparison: ARB leads with extensive DeFi applications deployment and higher TVL ($9.79B vs Blast's $1.18B); BLY offers native ETH and stablecoin yield features that differentiate its ecosystem approach
Macroeconomic and Market Cycles
- Inflation performance: Both tokens serve as blockchain governance assets rather than direct inflation hedges
- Macroeconomic monetary policy: Both are influenced by crypto market sentiment and Ethereum's performance
- Geopolitical factors: Both platforms focus on scaling Ethereum and are similarly affected by global crypto adoption trends
III. 2025-2030 Price Prediction: BLY vs ARB
Short-term Prediction (2025)
- BLY: Conservative $0.002973 - $0.003129 | Optimistic $0.003129 - $0.003817
- ARB: Conservative $0.19712 - $0.3584 | Optimistic $0.3584 - $0.404992
Mid-term Prediction (2027)
- BLY may enter a growth phase, with prices expected in the range of $0.002206 - $0.005215
- ARB may enter a growth phase, with prices expected in the range of $0.338259 - $0.600007
- Key drivers: Institutional capital inflow, ETF, ecosystem development
Long-term Prediction (2030)
- BLY: Base scenario $0.005911 - $0.006222 | Optimistic scenario $0.006222 - $0.007217
- ARB: Base scenario $0.471217 - $0.724949 | Optimistic scenario $0.724949 - $0.906187
Disclaimer
BLY:
| 年份 | 预测最高价 | 预测平均价格 | 预测最低价 | 涨跌幅 |
|---|---|---|---|---|
| 2025 | 0.00381738 | 0.003129 | 0.00297255 | 0 |
| 2026 | 0.0045498789 | 0.00347319 | 0.0031953348 | 11 |
| 2027 | 0.005214994785 | 0.00401153445 | 0.0022063439475 | 28 |
| 2028 | 0.00562818283335 | 0.0046132646175 | 0.003367683170775 | 47 |
| 2029 | 0.007322634927357 | 0.005120723725425 | 0.003174848709763 | 63 |
| 2030 | 0.007217148018614 | 0.006221679326391 | 0.005910595360071 | 98 |
ARB:
| 年份 | 预测最高价 | 预测平均价格 | 预测最低价 | 涨跌幅 |
|---|---|---|---|---|
| 2025 | 0.404992 | 0.3584 | 0.19712 | 0 |
| 2026 | 0.42368256 | 0.381696 | 0.23283456 | 6 |
| 2027 | 0.6000070272 | 0.40268928 | 0.3382589952 | 12 |
| 2028 | 0.70188741504 | 0.5013481536 | 0.285768447552 | 39 |
| 2029 | 0.8482810758912 | 0.60161778432 | 0.4451971603968 | 67 |
| 2030 | 0.906186787632 | 0.7249494301056 | 0.47121712956864 | 102 |
IV. Investment Strategy Comparison: BLY vs ARB
Long-term vs Short-term Investment Strategy
- BLY: Suitable for investors focused on agricultural supply chain solutions and niche blockchain applications
- ARB: Suitable for investors looking for exposure to Ethereum scaling solutions and broader DeFi ecosystem growth
Risk Management and Asset Allocation
- Conservative investors: BLY: 10% vs ARB: 90%
- Aggressive investors: BLY: 30% vs ARB: 70%
- Hedging tools: Stablecoin allocation, options, cross-currency portfolios
V. Potential Risk Comparison
Market Risk
- BLY: Limited market presence and lower liquidity
- ARB: Higher correlation with overall crypto market trends and Ethereum performance
Technical Risk
- BLY: Scalability, network stability in early-stage development
- ARB: Smart contract vulnerabilities, potential network congestion during high demand
Regulatory Risk
- Global regulatory policies may affect both tokens, with ARB potentially facing more scrutiny due to its larger ecosystem and higher market cap
VI. Conclusion: Which Is the Better Buy?
📌 Investment Value Summary:
- BLY advantages: Unique focus on agricultural supply chain, potential for niche market growth
- ARB advantages: Established ecosystem, strong institutional backing, proven scaling technology
✅ Investment Advice:
- Novice investors: Consider a small allocation to ARB as part of a diversified crypto portfolio
- Experienced investors: Balanced approach with a majority in ARB and smaller speculative position in BLY
- Institutional investors: Focus on ARB for its liquidity and ecosystem growth potential
⚠️ Risk Warning: The cryptocurrency market is highly volatile, and this article does not constitute investment advice. None
VII. FAQ
Q1: What are the main differences between BLY and ARB? A: BLY focuses on agricultural food production and distribution on blockchain, while ARB is an Ethereum scaling solution. BLY has a fixed supply of 1 billion tokens, while ARB has a total supply of 10 billion tokens with gradual distribution. ARB has a larger ecosystem with over 300 applications and higher institutional adoption.
Q2: Which token has performed better historically? A: ARB has shown better historical performance. While BLY's all-time high was $0.724004 in April 2021, ARB reached its all-time high of $4.00 in March 2023. As of October 2025, ARB is trading at $0.3583, while BLY is at $0.003129.
Q3: How do their market capitalizations and trading volumes compare? A: ARB has a significantly higher market capitalization and trading volume compared to BLY. As of October 2025, ARB's 24-hour trading volume is $9,250,737.41, while BLY's is $14,856.42.
Q4: What are the key factors affecting the investment value of BLY and ARB? A: Key factors include supply mechanisms, institutional adoption, technical development, ecosystem building, and macroeconomic conditions. ARB generally leads in most of these areas, particularly in institutional adoption and ecosystem development.
Q5: What are the long-term price predictions for BLY and ARB? A: By 2030, BLY is predicted to reach $0.005911 - $0.007217 in optimistic scenarios, while ARB is expected to reach $0.724949 - $0.906187. These predictions are based on current trends and potential market developments.
Q6: How should investors allocate their assets between BLY and ARB? A: Conservative investors might consider allocating 10% to BLY and 90% to ARB, while more aggressive investors could allocate 30% to BLY and 70% to ARB. The exact allocation should depend on individual risk tolerance and investment goals.
Q7: What are the main risks associated with investing in BLY and ARB? A: Both tokens face market risks, technical risks, and regulatory risks. BLY has additional risks related to limited market presence and lower liquidity, while ARB may be more susceptible to overall crypto market trends and potential network congestion during high demand periods.
Share
Content