SOL ve STX: Akıllı Sözleşme Fonksiyonelliğinde Hangi Kripto Para Avantajlı?

Giriş: SOL ve STX Yatırımı Karşılaştırması
Kripto para piyasasında Solana ile Stacks karşılaştırması, yatırımcıların göz ardı edemeyeceği bir başlıktır. Bu iki proje; piyasa değeri, uygulama alanları ve fiyat performansı bakımından birbirinden ayrılırken, aynı zamanda kripto para sektöründe farklı pozisyonları temsil etmektedir.
Solana (SOL): 2017’de piyasaya sürülmesinden bu yana, ölçeklenebilirliğe odaklanan yüksek performanslı blockchain protokolüyle piyasada kabul görmüştür.
Stacks (STX): 2019’da tanıtılan bu proje, merkeziyetsiz uygulamalar için yeni bir internet altyapısı olarak dikkat çekiyor ve blockchain’in “Google”ı olmayı amaçlıyor.
Bu makalede, Solana ve Stacks’in yatırım değerleri; geçmiş fiyat eğilimleri, arz mekanizmaları, kurumsal benimseme, teknik ekosistem ve gelecek tahminleri üzerinden karşılaştırılacak ve yatırımcıların en çok merak ettiği soruya yanıt aranacaktır:
“Şu anda hangisi daha avantajlı bir yatırım?”
I. Fiyat Geçmişi Karşılaştırması ve Güncel Piyasa Durumu
Solana (SOL) ve Stacks (STX) Geçmiş Fiyat Eğilimleri
- 2021: SOL, DeFi ve NFT alanlarında hızla benimsenerek $2’nin altından $260’a ulaşarak rekor kırdı.
- 2022: STX, Bitcoin City girişimiyle ilgi topladı; fakat genel kripto piyasasındaki dalgalanma fiyatlara yansıdı.
- Kıyaslama: 2022 ayı piyasasında SOL, $260’dan $10’un altına geriledi; STX ise daha az oynaklık gösterdi ancak yine de kayda değer düşüşler yaşadı.
Güncel Piyasa Durumu (15 Ekim 2025)
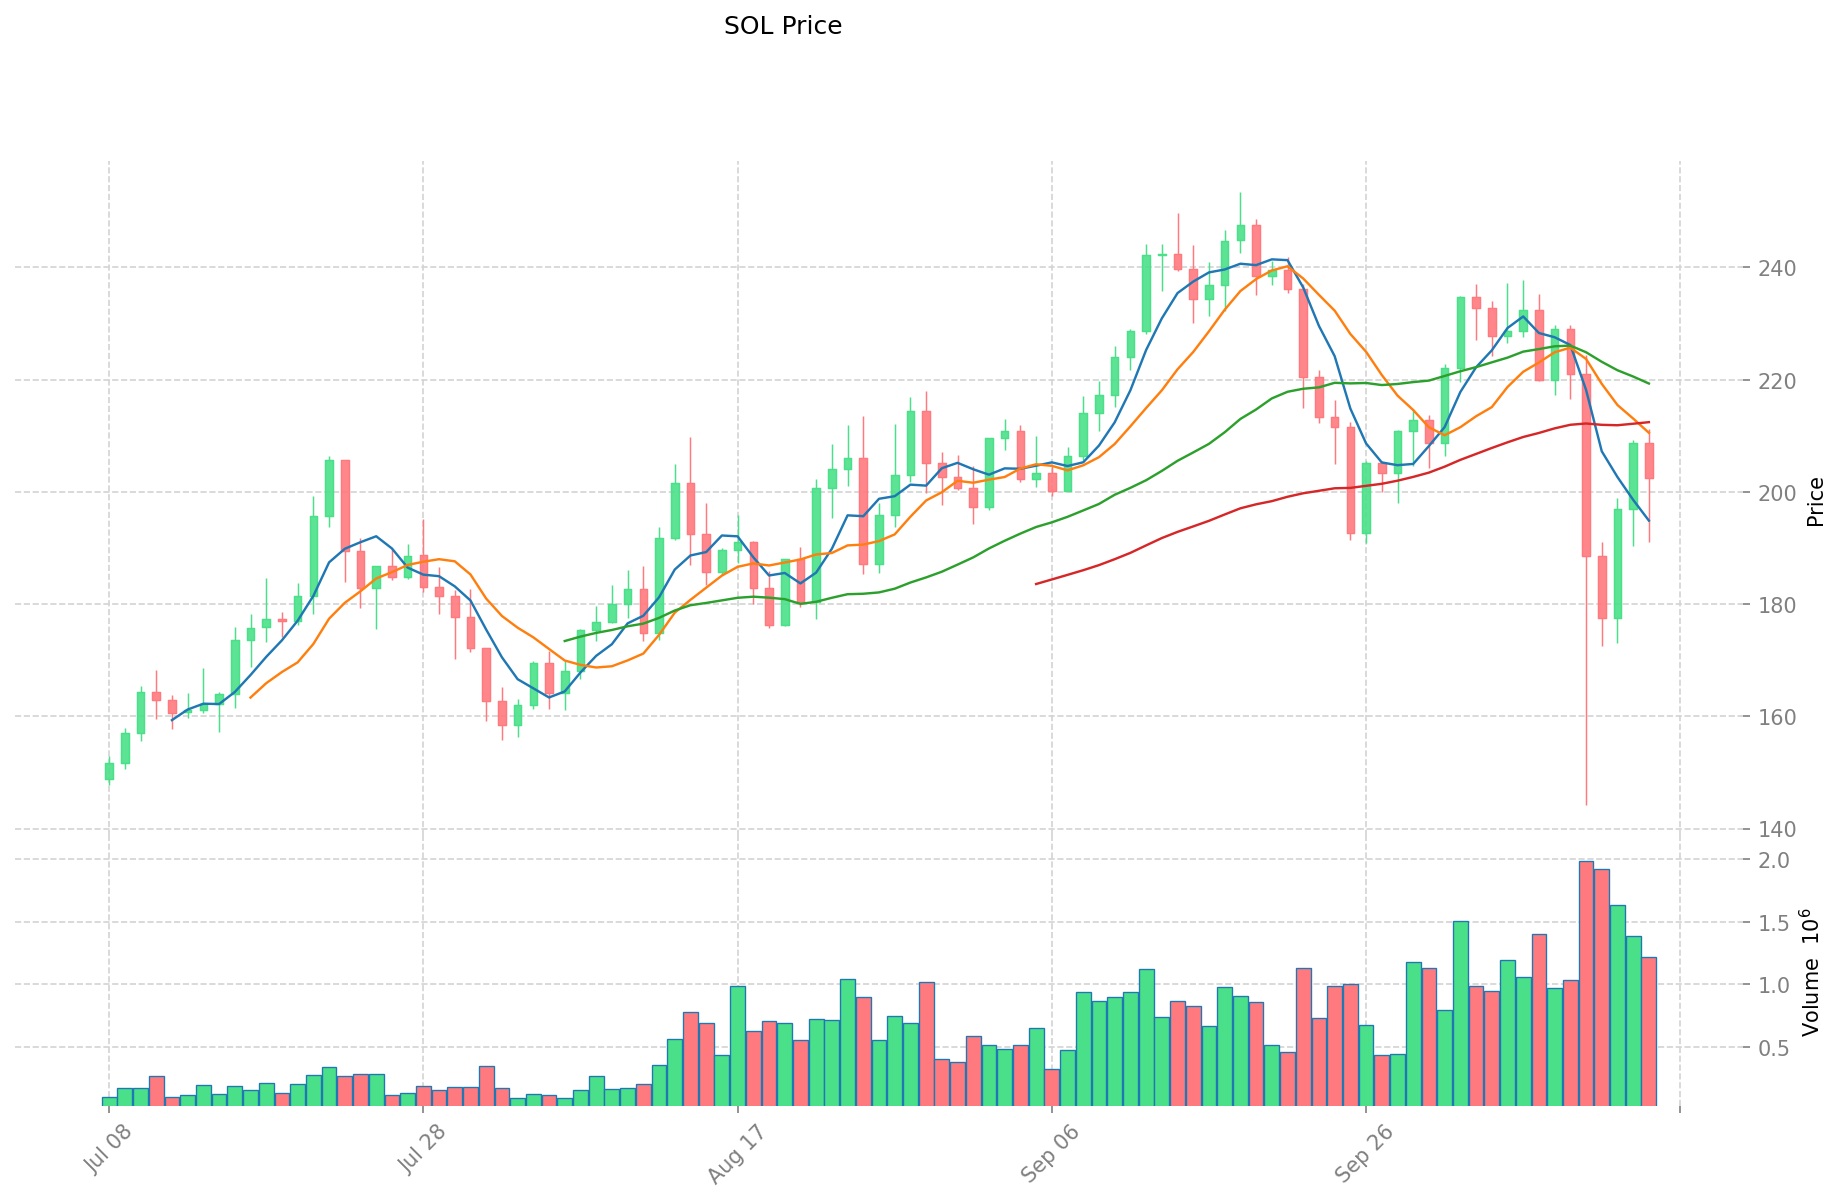
- SOL güncel fiyatı: $202,58
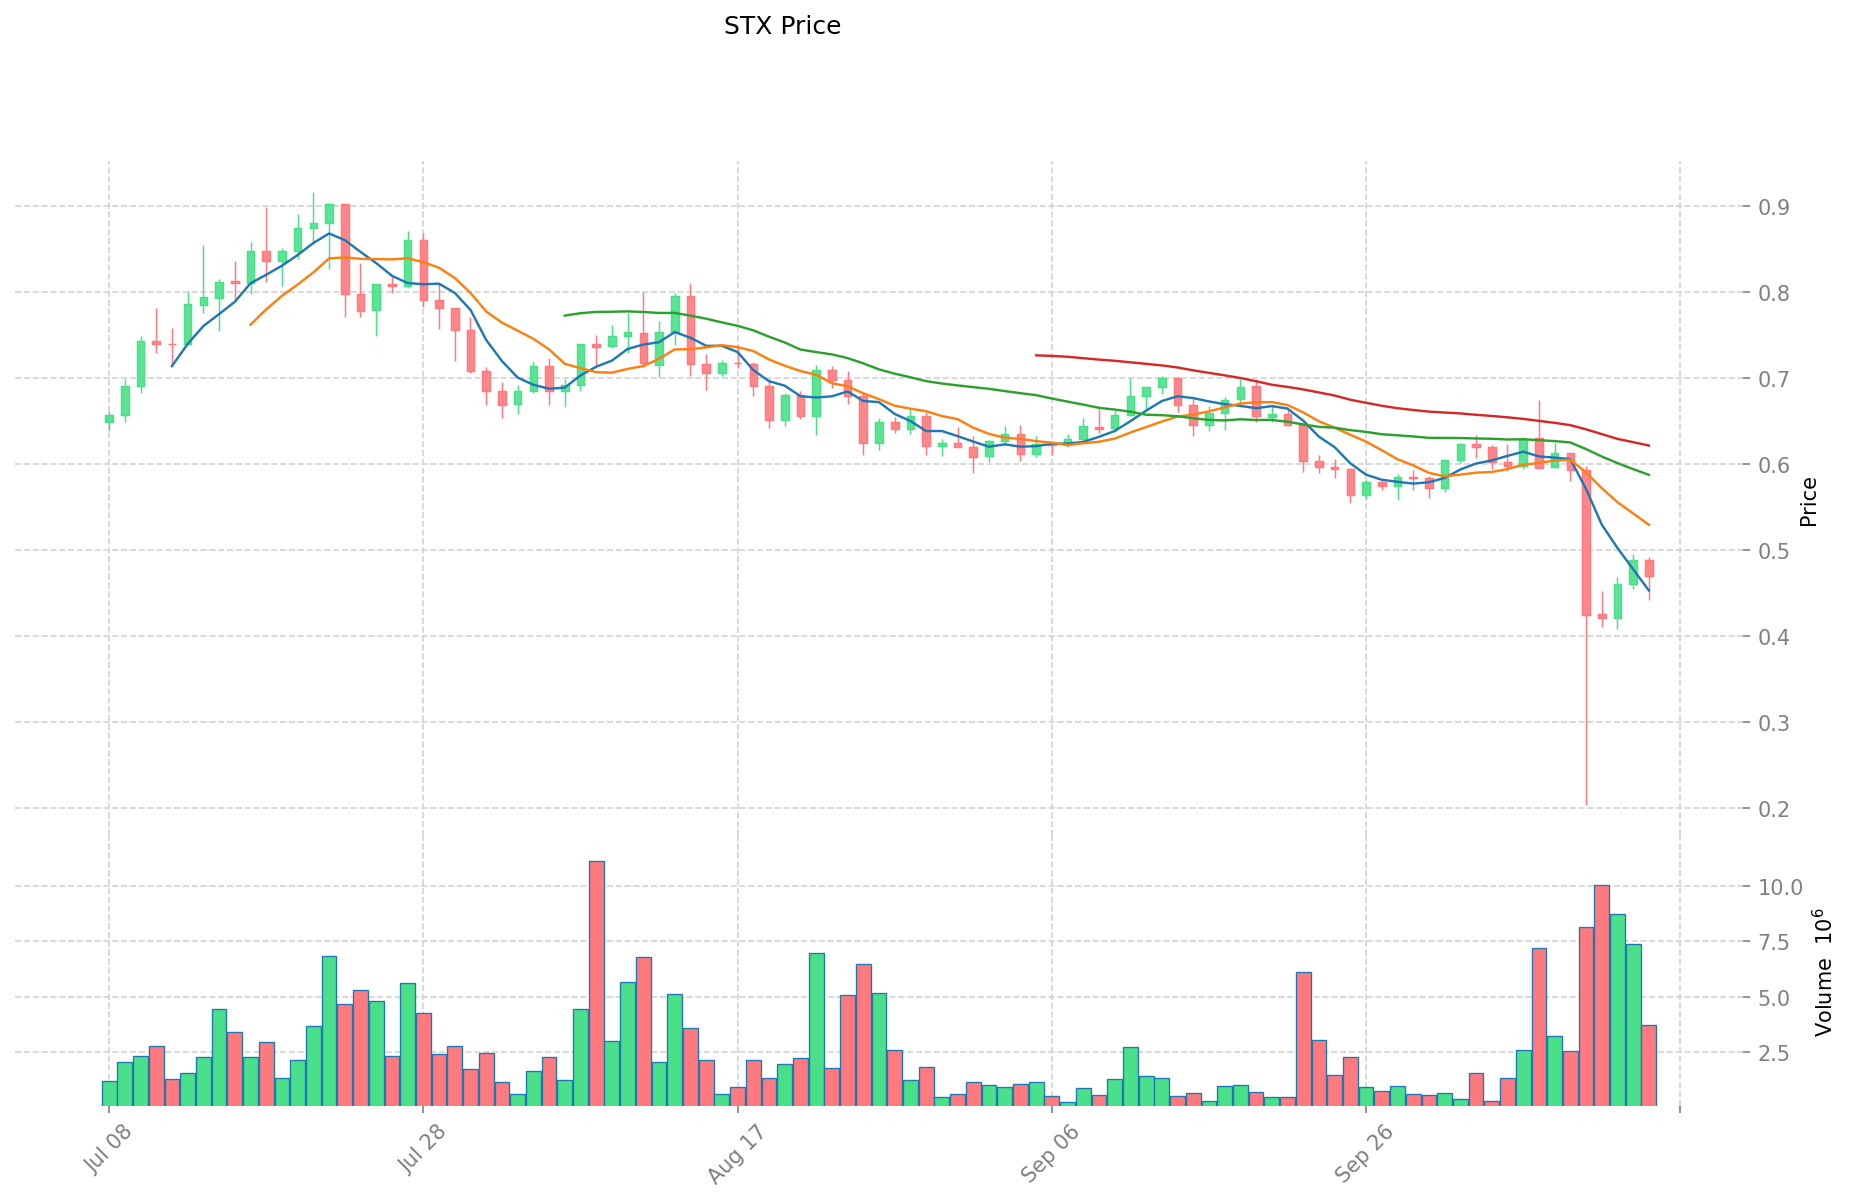
- STX güncel fiyatı: $0,4691
- 24 saatlik işlem hacmi: SOL $222.271.506, STX $1.646.842
- Piyasa Duyarlılık Endeksi (Korku & Açgözlülük Endeksi): 34 (Korku)
Anlık fiyatları görüntülemek için tıklayın:
- SOL'un güncel fiyatına bakın Piyasa Fiyatı
- STX'in güncel fiyatına bakın Piyasa Fiyatı
SOL Yatırım Değerini Etkileyen Unsurlar
Teknik Performans ve Konsensüs Mekanizması
- Proof of History (PoH) + Proof of Stake (PoS): Solana’nın hibrit konsensüs modeli, saniyede 65.000 işleme kadar yüksek kapasite sunar
- İşlem Maliyeti Avantajı: Solana üzerinde işlemler $0,01’in altında ve mikro ödemeler ile yüksek frekanslı işlemler için uygundur
- Ölçeklenebilirlik: Donanım ve düğüm sayısındaki artış ile Solana’nın performansı ölçeklenebilir
Ekosistem Gelişimi ve Benimsenme
- DeFi Büyümesi: Solana’nın DeFi TVL’i $1 milyara yaklaştı ve yaklaşık %40 büyüdü
- Aktif Adresler: 250.000’den fazla aktif adres ile ciddi bir işlem hacmi mevcut
- Başlıca Protokoller: Pyth Network, Jupiter ve Jito Network; Solana’nın DeFi ekosisteminin temelini oluşturuyor
- NFT Pazarı: Magic Eden’dan Mad Labs’e geçişle günlük ortalama $660.000 işlem hacmiyle önemli büyüme kaydedildi
SOL Token Kullanım Alanları
- Ağ Yakıtı: Tüm zincir içi işlemler ve akıllı kontrat ücretleri için gereklidir
- Stake: Dolaşımdaki SOL’un %83,9’u stake edilmiş olup; yıllık getiri oranı %6,3’tür
- Ekosistem Erişimi: Solana ekosistemindeki uygulamalara giriş için kullanılır
- Geniş Kullanım: DeFi borç verme, alım-satım platformları, NFT oluşturma, GameFi ve Web3 ödemelerinde kullanılır
Piyasa Konumu ve Stratejik Gelişmeler
- Mobil Entegrasyon: Solana Mobile’ın Saga telefonu 20.000 adet satıldı; Seeker telefonu için 140.000 ön sipariş alındı (fiyatı $450)
- Blinks/Actions: 2024 yılında kullanıma sunulan entegrasyon araçları, platformlar arası blokzincir işlemlerini kolaylaştırıyor
- Kurumsal Saklama: İlk 100 büyük sahiplik oranı %15’ten %33’e yükseldi ve kurumsal ilgide artış gözlendi
- ETF Potansiyeli: SOL, piyasa değeriyle ilk 5 kripto arasında yer alıyor ve ETF onayı potansiyeline sahip
Risk Unsurları
- Merkezi Saklama: FTX/Alameda, Ağustos 2023 itibarıyla toplam SOL arzının yaklaşık %10’unu (55 milyonun üzerinde) elinde bulunduruyordu
- Doğrulayıcı Yoğunlaşması: İlk 19 düğüm, toplam stake bakiyesinin %33’ünü kontrol ediyor
- Geçmişteki İstikrarsızlık: Ağırlıklı olarak ağ kesintileri yaşansa da, son dönemde yapılan güncellemeler ve izleme ile stabilite arttı
Piyasa Toparlanma Süreci
- Değerlenme Eğrisi: SOL'un güncel $31 milyar piyasa değeri, 2021’deki $75 milyarlık zirvenin %40’ı düzeyinde toparlanma anlamına geliyor
- Destekleyici Faktörler: Tamamlanmış ekosistem, yaşanan zorluklara rağmen piyasa değerinin korunmasına katkıda bulundu
- İnovasyon Katalizörleri: LSD çözümü JITO yeni zirvelere ulaşırken, Solana EVM uyumluluğu ile inscription protokolleri güç kazandı
III. 2025-2030 Fiyat Tahminleri: SOL ve STX
Kısa Vadeli Tahmin (2025)
- SOL: Temkinli $167,25 - $201,50 | İyimser $201,50 - $298,22
- STX: Temkinli $0,41 - $0,47 | İyimser $0,47 - $0,58
Orta Vadeli Tahmin (2027)
- SOL büyüme dönemine girebilir; beklenen fiyat $151,84 - $370,59
- STX büyüme dönemine girebilir; beklenen fiyat $0,34 - $0,91
- Başlıca tetikleyiciler: Kurumsal sermaye girişi, ETF’ler, ekosistem gelişimi
Uzun Vadeli Tahmin (2030)
- SOL: Temel senaryo $194,64 - $360,44 | İyimser senaryo $360,44 - $403,70
- STX: Temel senaryo $0,80 - $1,00 | İyimser senaryo $1,00 - $1,10
Feragat: Bu tahminler, geçmiş veriler ve piyasa analizlerine dayanmaktadır. Kripto para piyasası oldukça dalgalı ve ani değişimlere açıktır. Tahminler yatırım tavsiyesi değildir; yatırım kararı öncesi mutlaka kendi araştırmanızı yapın.
SOL:
| Yıl | Tahmini En Yüksek Fiyat | Tahmini Ortalama Fiyat | Tahmini En Düşük Fiyat | Değişim Oranı |
|---|---|---|---|---|
| 2025 | 298,22 | 201,5 | 167,245 | 0 |
| 2026 | 264,8516 | 249,86 | 169,9048 | 23 |
| 2027 | 370,592352 | 257,3558 | 151,839922 | 26 |
| 2028 | 329,6727798 | 313,974076 | 276,29718688 | 54 |
| 2029 | 399,061050596 | 321,8234279 | 196,312291019 | 58 |
| 2030 | 403,69530795776 | 360,442239248 | 194,63880919392 | 77 |
STX:
| Yıl | Tahmini En Yüksek Fiyat | Tahmini Ortalama Fiyat | Tahmini En Düşük Fiyat | Değişim Oranı |
|---|---|---|---|---|
| 2025 | 0,579576 | 0,4674 | 0,406638 | 0 |
| 2026 | 0,72764832 | 0,523488 | 0,47637408 | 11 |
| 2027 | 0,9133295136 | 0,62556816 | 0,3378068064 | 33 |
| 2028 | 1,03875592968 | 0,7694488368 | 0,746365371696 | 63 |
| 2029 | 1,0939638837204 | 0,90410238324 | 0,7594460019216 | 92 |
| 2030 | 1,09893644682822 | 0,9990331334802 | 0,79922650678416 | 112 |
IV. Yatırım Stratejisi Karşılaştırması: SOL ve STX
Uzun Vadeli ve Kısa Vadeli Yatırım Stratejileri
- SOL: Ekosistem potansiyeli ve yüksek performanslı blockchain teknolojisi arayan yatırımcılar için uygundur
- STX: Bitcoin odaklı inovasyon ve merkeziyetsiz uygulamalarla ilgilenen yatırımcılar için uygundur
Risk Yönetimi ve Varlık Dağılımı
- Temkinli yatırımcılar: SOL %60, STX %40
- Agresif yatırımcılar: SOL %75, STX %25
- Koruma araçları: Stablecoin tahsisi, opsiyonlar, çapraz para portföyleri
V. Potansiyel Risk Karşılaştırması
Piyasa Riskleri
- SOL: Yüksek oynaklık, boğa piyasasında aşırı değerlenme riski
- STX: Düşük likidite, genel piyasa rallilerinde düşük performans riski
Teknik Riskler
- SOL: Ölçeklenebilirlik sorunları, ağ istikrarında geçmişte yaşanan problemler
- STX: Bitcoin ağına olan bağımlılık, smart contract zafiyeti riski
Düzenleyici Riskler
- Global regülasyon politikaları iki projeyi farklı şekilde etkileyebilir; SOL, daha yüksek piyasa değeri ve yaygın kullanım nedeniyle daha fazla denetime maruz kalabilir
VI. Sonuç: Hangisi Daha Avantajlı Yatırım?
📌 Yatırım Değeri Özeti:
- SOL avantajları: Yüksek performans, gelişen ekosistem, kurumsal ilgi
- STX avantajları: Bitcoin tabanlı inovasyon, Bitcoin merkezli DeFi’de büyüme potansiyeli
✅ Yatırım Tavsiyesi:
- Yeni yatırımcılar: Dengeli portföy için SOL’a ağırlık verilebilir
- Deneyimli yatırımcılar: Her iki projede fırsat arayın, SOL’u yüksek oranda değerlendirin
- Kurumsal yatırımcılar: Likidite ve piyasa değeri açısından SOL’a odaklanırken, STX’in uzun vadeli potansiyelini izleyin
⚠️ Risk Uyarısı: Kripto para piyasası son derece oynaktır. Bu makale yatırım tavsiyesi değildir. None
VII. Sıkça Sorulan Sorular
S1: Solana (SOL) ve Stacks (STX) arasındaki temel farklar nelerdir? C: Solana, ölçeklenebilirliğe odaklanan yüksek performanslı bir blockchain’dir; Stacks ise Bitcoin’e akıllı kontratları entegre etmeyi amaçlar. SOL, daha büyük piyasa değeri, yüksek işlem hacmi ve DeFi ile NFT alanında daha gelişmiş bir ekosisteme sahiptir. STX ise Bitcoin ekosistemine daha yakın ve Bitcoin tabanlı inovasyona odaklıdır.
S2: Geçmişte hangi kripto para daha iyi fiyat performansı gösterdi? C: Solana (SOL) tarihsel olarak daha iyi fiyat performansı sergiledi. 2021’de SOL, $2’nin altından $260’a kadar yükseldi; STX ise daha sınırlı bir büyüme kaydetti. Ancak SOL, 2022 ayı piyasasında daha sert değer kaybı yaşadı.
S3: Solana’nın yatırım değerini artıran başlıca unsurlar nelerdir? C: Solana’da hibrit konsensüs mekanizması (PoH+PoS), düşük işlem maliyeti, gelişen DeFi ekosistemi, kurumsal ilgi ve ETF onayı potansiyeli öne çıkıyor. Mobil entegrasyon ve Blinks/Actions gibi stratejik gelişmeler de platformun değerini destekliyor.
S4: 2030 için SOL ve STX fiyat tahminleri nasıl karşılaştırılıyor? C: 2030’da SOL’un baz senaryosu $194,64 - $360,44 arası; iyimser senaryosu ise $360,44 - $403,70 arasıdır. STX’in baz senaryosu $0,80 - $1,00, iyimser senaryosu ise $1,00 - $1,10’dur. Uzun vadede SOL’un getiri potansiyeli daha yüksek görünmektedir.
S5: SOL ve STX yatırımıyla ilgili başlıca riskler nelerdir? C: SOL’da yüksek volatilite, boğa piyasasında aşırı değerlenme riski, ölçeklenebilirlik sorunları ve geçmişte ağ istikrarsızlığı başlıca risklerdir. STX’te ise düşük likidite, Bitcoin ağına bağımlılık ve potansiyel smart contract zafiyetleri ön plana çıkar. Her iki proje de regülasyon riskine açıktır; SOL, daha geniş piyasa varlığıyla daha fazla incelemeye tabi olabilir.
S6: Yatırımcılar SOL ve STX arasında varlık dağılımını nasıl yapmalı? C: Temkinli yatırımcılar %60 SOL - %40 STX, agresif yatırımcılar ise %75 SOL - %25 STX portföyünü düşünebilir. Yeni yatırımcılar SOL’u önceliklendirirken, deneyimli yatırımcılar her iki projede fırsat arayabilir ve portföyde SOL’a daha yüksek ağırlık verebilir.
S7: SOL veya STX’in değerini değiştirecek önemli gelişmeler var mı? C: SOL için olası ETF onayı, DeFi ve NFT ekosisteminin büyümesi ile mobil uygulama girişimleri önem taşıyor. STX için ise Bitcoin tabanlı DeFi gelişmeleri ve Bitcoin ekosistemiyle entegrasyon, gelecekteki değerini artırabilir.
Share
Content
Giriş: SOL ve STX Yatırımı Karşılaştırması
I. Fiyat Geçmişi Karşılaştırması ve Güncel Piyasa Durumu
SOL Yatırım Değerini Etkileyen Unsurlar
III. 2025-2030 Fiyat Tahminleri: SOL ve STX
IV. Yatırım Stratejisi Karşılaştırması: SOL ve STX
V. Potansiyel Risk Karşılaştırması
VI. Sonuç: Hangisi Daha Avantajlı Yatırım?
VII. Sıkça Sorulan Sorular
How to Buy Cryptocurrency


Trending Cryptocurrencies


Solana (SOL) iyi bir yatırım mı?: Yüksek performanslı bu blockchain’in potansiyeli ve riskleri üzerine analiz

Solana (SOL) iyi bir yatırım mı?: Yüksek performanslı bu blockchain’in potansiyeli ve riskleri üzerine analiz
Bir Kripto Projenin Temel Analizi: Göz Önünde Bulundurulması Gereken 5 Temel Faktör

2025 SOL Fiyat Tahmini: Solana'nın Gelecekteki Değerine Yönelik Büyüme Katalizörleri ve Piyasa Senaryolarının Analizi
9 Haneli Rakamlar Ne Kadar?

Kripto para piyasalarında marjin işlemlerinde uzmanlaşmak
Kripto ticaretinde boğa flama formasyonunun mantığını kavramak
Dijital Cüzdanları Anlamak: Web3 İşlemlerinde Güvenliği Sağlamak İçin Başlangıç Seviyesinde Kapsamlı Rehber

NFT Nadirliklerinde Uzmanlaşma: Puanlama ve Değerleme İçin Kapsamlı Bir Rehber

Ethereum'da Devrim Yaratmak: Mantle Blockchain ile Layer 2 Çözümlerinin Gücünü Keşfedin