STETH vs QNT: Comparing Two Innovative Blockchain Assets for Long-Term Investment Potential
Introduction: STETH vs QNT Investment Comparison
In the cryptocurrency market, the comparison between STETH vs QNT has always been a topic that investors cannot avoid. The two not only have significant differences in market cap ranking, application scenarios, and price performance, but also represent different cryptocurrency asset positioning.
Lido Staked Ether (STETH): Since its launch, it has gained market recognition for its ETH 2.0 liquid staking solution.
Quant (QNT): Since 2018, it has been hailed as a technology provider enabling trusted digital interaction, and is one of the cryptocurrencies with a focus on enterprise blockchain adoption.
This article will comprehensively analyze the investment value comparison between STETH vs QNT, focusing on historical price trends, supply mechanisms, institutional adoption, technological ecosystems, and future predictions, and attempt to answer the question that investors are most concerned about:
"Which is the better buy right now?"
I. Price History Comparison and Current Market Status
STETH and QNT Historical Price Trends
- 2021: STETH price surged due to increasing adoption of Ethereum staking.
- 2021: QNT experienced significant growth following its Overledger Network launch.
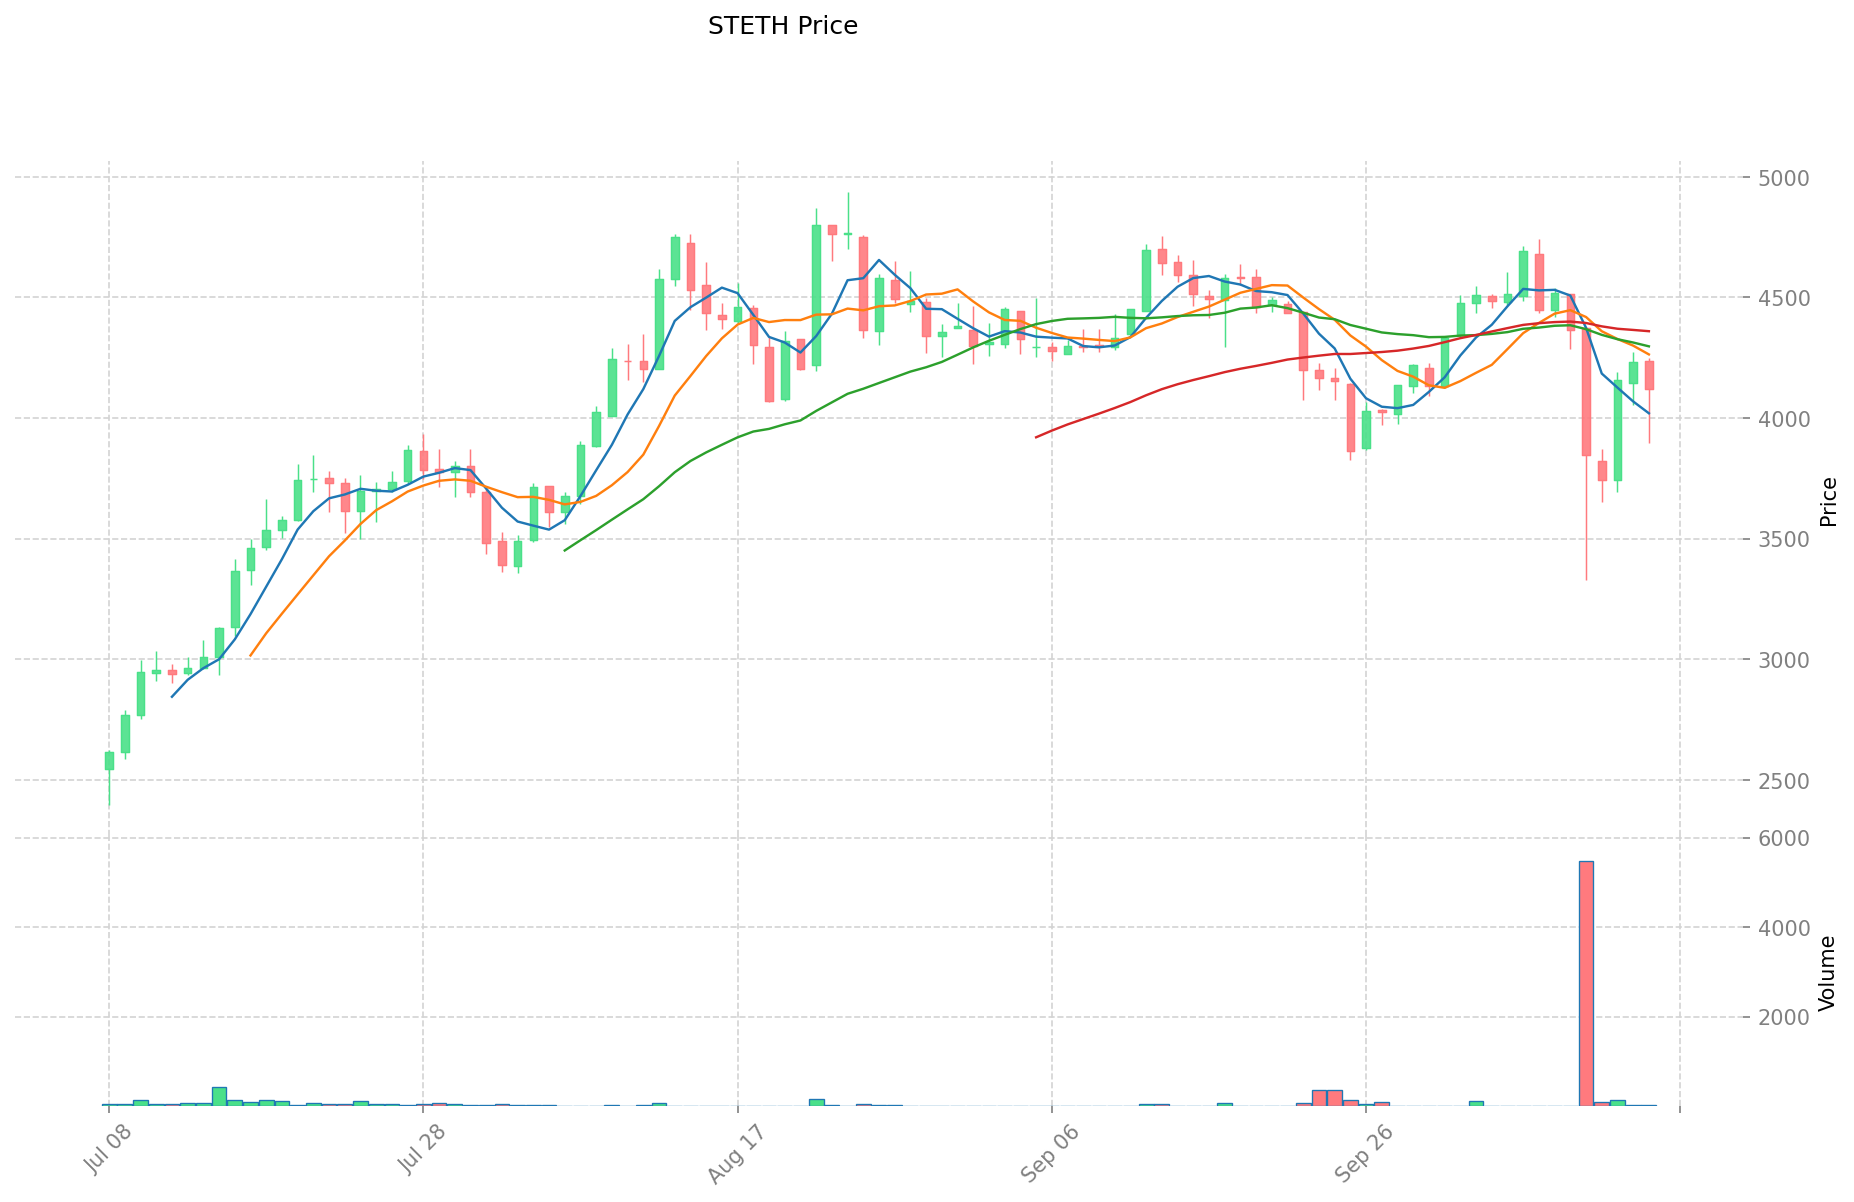
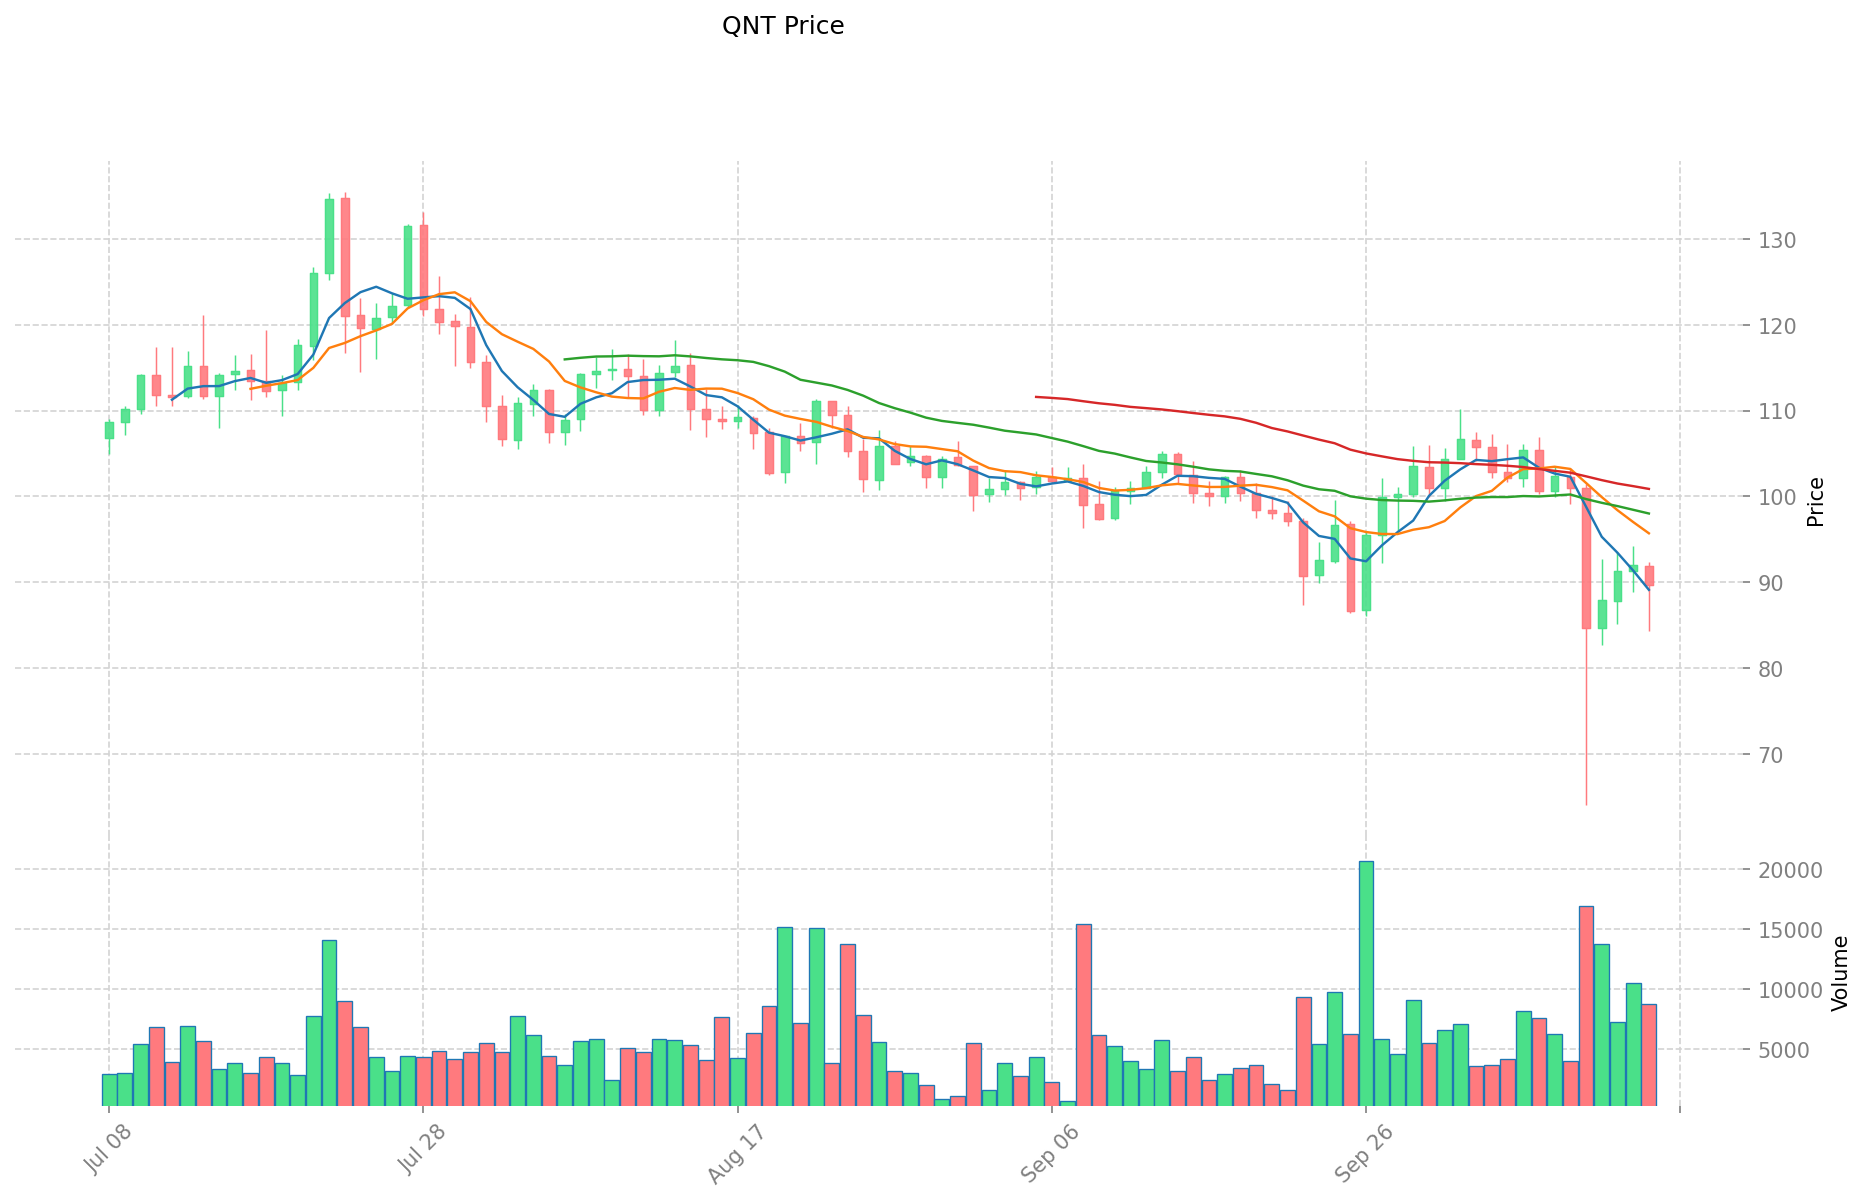
- Comparative analysis: During the 2022 bear market, STETH dropped from its all-time high of $4,932.89 to a low of $482.90, while QNT showed relatively less volatility.
Current Market Situation (2025-10-15)
- STETH current price: $4,095.4
- QNT current price: $89.24
- 24-hour trading volume: STETH $69,991,917.01 vs QNT $760,325.34
- Market Sentiment Index (Fear & Greed Index): 34 (Fear)
Click to view real-time prices:
- Check STETH current price Market Price
- Check QNT current price Market Price
II. Core Factors Influencing STETH vs QNT Investment Value
Supply Mechanisms Comparison (Tokenomics)
- STETH: Liquid staking token with yield-generating properties, offering 3-4% annual returns in 2024
- QNT: Limited supply token whose value is tied to blockchain interoperability adoption
- 📌 Historical Pattern: STETH's value proposition is centered around liquidity, allowing stakers to avoid exit queues through decentralized exchanges
Institutional Adoption and Market Applications
- Institutional Holdings: STETH demonstrates stronger institutional appeal through its integration with DeFi platforms
- Enterprise Adoption: STETH provides more immediate utility through its liquid staking mechanism, while QNT's value depends on broader blockchain technology acceptance
- Regulatory Stance: STETH faced depeg concerns following the Terra/Luna collapse, indicating potential regulatory vulnerability
Technical Development and Ecosystem Building
- STETH Technical Upgrades: Enhanced liquidity solutions allowing immediate exits without queues
- QNT Technical Development: Focus on interoperability between blockchain networks
- Ecosystem Comparison: STETH shows stronger integration with DeFi protocols with TVL fluctuating between $52.9-54.1 billion
Macroeconomic and Market Cycles
- Inflation Environment Performance: STETH offers inflation-beating returns of 3-4% annually
- Macroeconomic Monetary Policy: Market sentiment significantly impacts both assets, with positive news about adoption driving value
- Geopolitical Factors: Market volatility affects STETH's peg stability, as demonstrated during the Terra ecosystem collapse
III. 2025-2030 Price Prediction: STETH vs QNT
Short-term Prediction (2025)
- STETH: Conservative $2,580.10 - $4,095.40 | Optimistic $4,095.40 - $4,750.66
- QNT: Conservative $61.61 - $89.29 | Optimistic $89.29 - $92.86
Mid-term Prediction (2027)
- STETH may enter a growth phase, with projected prices $4,320.42 - $6,627.91
- QNT may enter a growth phase, with projected prices $65.00 - $149.18
- Key drivers: Institutional capital inflow, ETFs, ecosystem development
Long-term Prediction (2030)
- STETH: Base scenario $3,770.79 - $6,733.56 | Optimistic scenario $6,733.56 - $9,830.99
- QNT: Base scenario $161.18 - $169.66 | Optimistic scenario $169.66 - $186.63
Disclaimer: This analysis is for informational purposes only and should not be considered as financial advice. Cryptocurrency markets are highly volatile and unpredictable. Always conduct your own research before making any investment decisions.
STETH:
| 年份 | 预测最高价 | 预测平均价格 | 预测最低价 | 涨跌幅 |
|---|---|---|---|---|
| 2025 | 4750.664 | 4095.4 | 2580.102 | 0 |
| 2026 | 5396.09904 | 4423.032 | 4201.8804 | 8 |
| 2027 | 6627.913452 | 4909.56552 | 4320.4176576 | 19 |
| 2028 | 5941.80167058 | 5768.739486 | 2999.74453272 | 40 |
| 2029 | 7611.851751777 | 5855.27057829 | 3805.9258758885 | 42 |
| 2030 | 9830.99930094891 | 6733.5611650335 | 3770.79425241876 | 64 |
QNT:
| 年份 | 预测最高价 | 预测平均价格 | 预测最低价 | 涨跌幅 |
|---|---|---|---|---|
| 2025 | 92.8616 | 89.29 | 61.6101 | 0 |
| 2026 | 122.041572 | 91.0758 | 72.86064 | 2 |
| 2027 | 149.1821604 | 106.558686 | 65.00079846 | 19 |
| 2028 | 176.461184016 | 127.8704232 | 70.32873276 | 43 |
| 2029 | 187.16393843784 | 152.165803608 | 88.25616609264 | 70 |
| 2030 | 186.631358125212 | 169.66487102292 | 161.181627471774 | 90 |
IV. Investment Strategy Comparison: STETH vs QNT
Long-term vs Short-term Investment Strategies
- STETH: Suitable for investors focused on Ethereum ecosystem growth and staking rewards
- QNT: Suitable for investors betting on enterprise blockchain adoption and interoperability
Risk Management and Asset Allocation
- Conservative investors: STETH: 70% vs QNT: 30%
- Aggressive investors: STETH: 50% vs QNT: 50%
- Hedging tools: Stablecoin allocation, options, cross-currency combinations
V. Potential Risk Comparison
Market Risks
- STETH: Vulnerability to Ethereum market fluctuations and staking yield changes
- QNT: Dependence on broader blockchain adoption rates and interoperability demand
Technical Risks
- STETH: Scalability, network stability, and smart contract vulnerabilities
- QNT: Adoption rate of Overledger Network, potential security flaws
Regulatory Risks
- Global regulatory policies may impact STETH more due to its connection with Ethereum and DeFi
VI. Conclusion: Which Is the Better Buy?
📌 Investment Value Summary:
- STETH advantages: Liquid staking solution, immediate utility, strong DeFi integration
- QNT advantages: Limited supply, focus on enterprise blockchain adoption, interoperability potential
✅ Investment Advice:
- New investors: Consider a higher allocation to STETH due to its more established market presence
- Experienced investors: Balanced approach with exposure to both assets
- Institutional investors: Evaluate STETH for its liquid staking properties and QNT for long-term blockchain interoperability potential
⚠️ Risk Warning: Cryptocurrency markets are highly volatile. This article does not constitute investment advice. None
VII. FAQ
Q1: What are the main differences between STETH and QNT? A: STETH is a liquid staking token for Ethereum, offering yield-generating properties, while QNT is a limited supply token focused on blockchain interoperability. STETH is more integrated with DeFi platforms, whereas QNT aims for enterprise blockchain adoption.
Q2: Which asset has shown better price stability historically? A: QNT has demonstrated relatively less volatility compared to STETH, especially during the 2022 bear market. STETH experienced a more significant drop from its all-time high.
Q3: How do the supply mechanisms of STETH and QNT differ? A: STETH has a dynamic supply based on Ethereum staking, offering 3-4% annual returns. QNT has a limited supply, with its value tied to blockchain interoperability adoption.
Q4: What are the key factors driving institutional adoption for each asset? A: STETH shows stronger institutional appeal through its integration with DeFi platforms and immediate utility. QNT's adoption depends more on broader acceptance of blockchain technology in enterprise settings.
Q5: How do the long-term price predictions for STETH and QNT compare? A: By 2030, STETH is predicted to reach $3,770.79 - $9,830.99 in various scenarios, while QNT is projected to be between $161.18 - $186.63. STETH shows higher potential for price appreciation.
Q6: What are the main risks associated with investing in STETH and QNT? A: STETH risks include vulnerability to Ethereum market fluctuations and staking yield changes. QNT risks involve dependence on blockchain adoption rates and interoperability demand. Both face regulatory and technical risks.
Q7: How should different types of investors approach STETH vs QNT allocation? A: Conservative investors might consider a 70% STETH / 30% QNT split, while aggressive investors could opt for a 50/50 allocation. New investors may favor STETH due to its established market presence, while experienced investors might balance exposure to both assets.
Share
Content