TRX vs BTC: Comparing the Performance and Potential of Two Crypto Heavyweights
Introduction: TRX vs BTC Investment Comparison
In the cryptocurrency market, TRON vs Bitcoin comparison has always been an unavoidable topic for investors. The two not only differ significantly in market cap ranking, application scenarios, and price performance, but also represent different cryptocurrency positioning.
TRON (TRX): Since its launch in 2017, it has gained market recognition for its focus on decentralized applications and content distribution.
Bitcoin (BTC): Since its inception in 2009, it has been hailed as "digital gold" and is one of the cryptocurrencies with the highest global trading volume and market capitalization.
This article will comprehensively analyze the investment value comparison between TRON and Bitcoin, focusing on historical price trends, supply mechanisms, institutional adoption, technological ecosystems, and future predictions, and attempt to answer the question investors care about most:
"Which is the better buy right now?" Here is the section on price history comparison and current market status:
I. Price History Comparison and Current Market Status
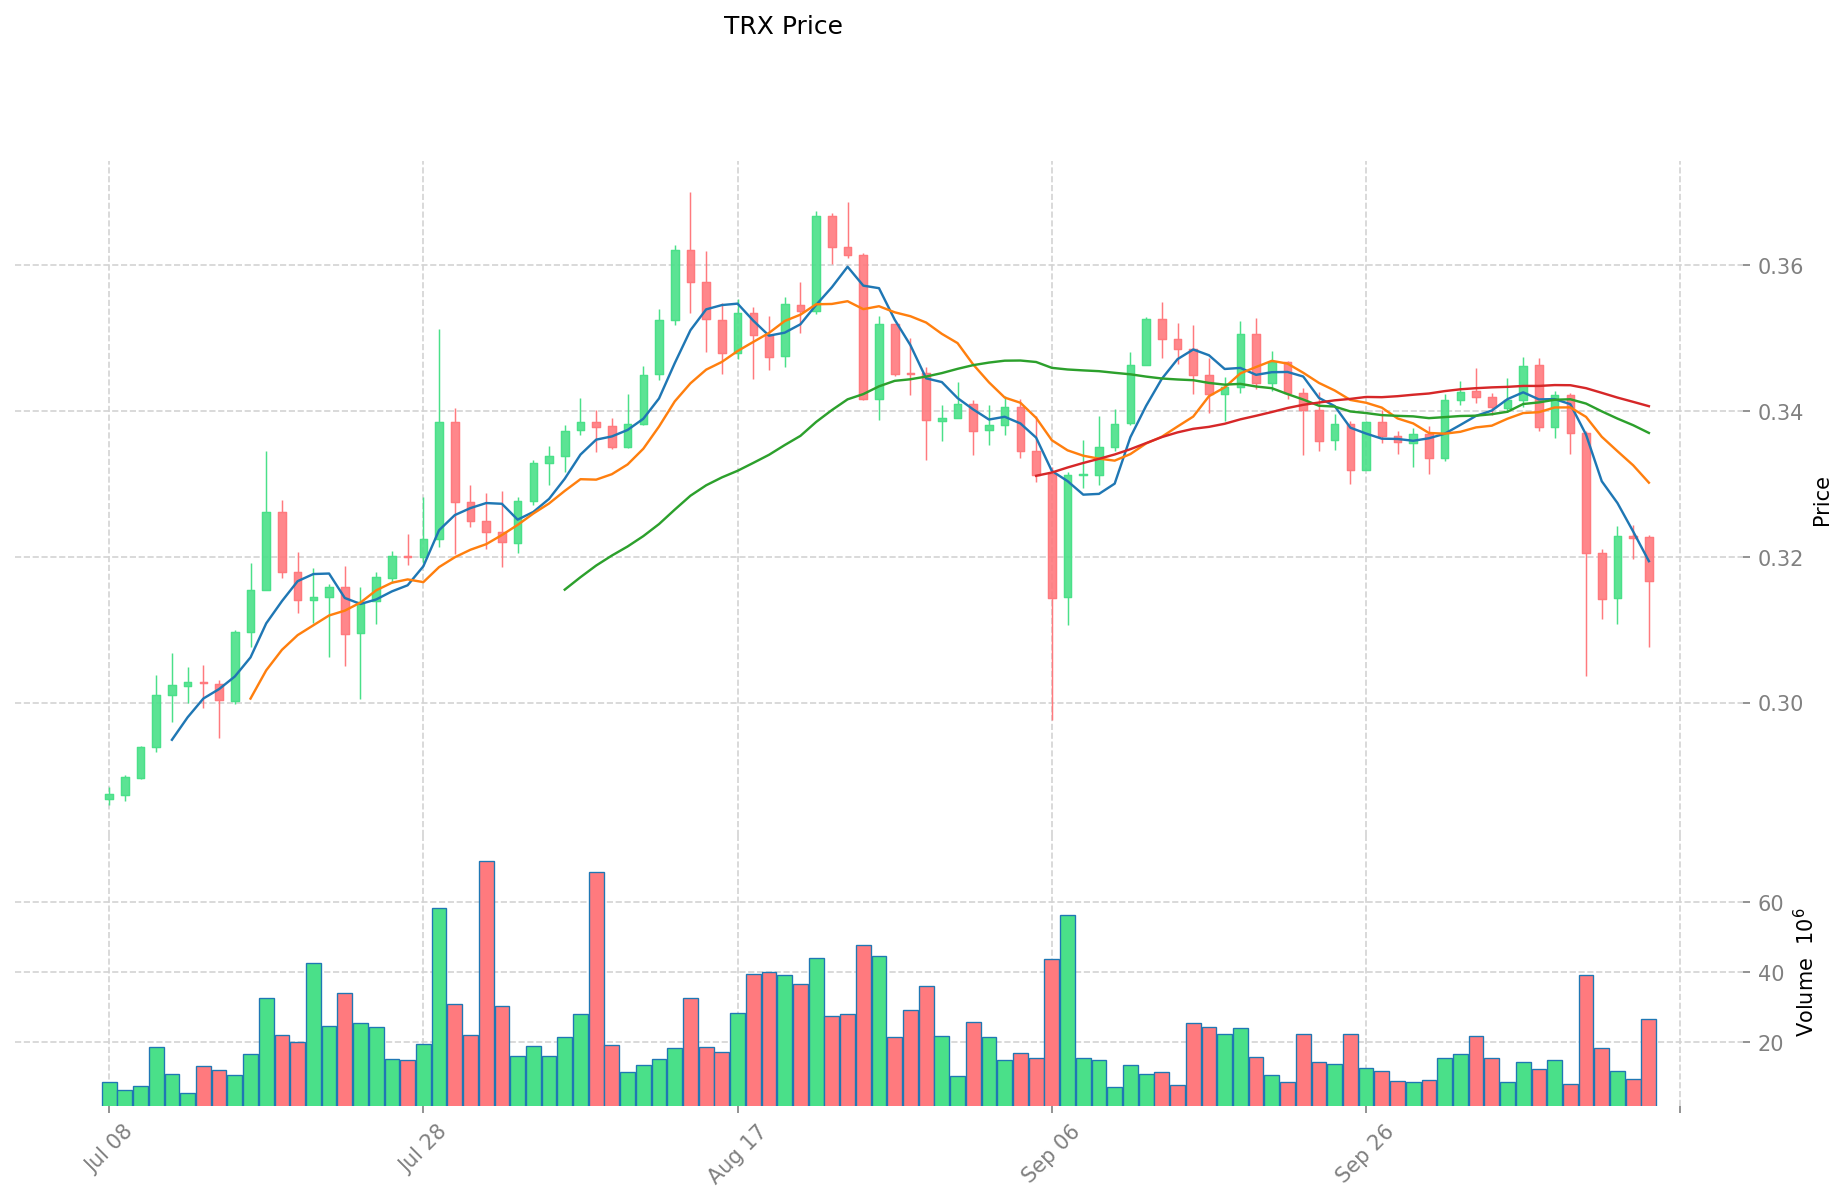
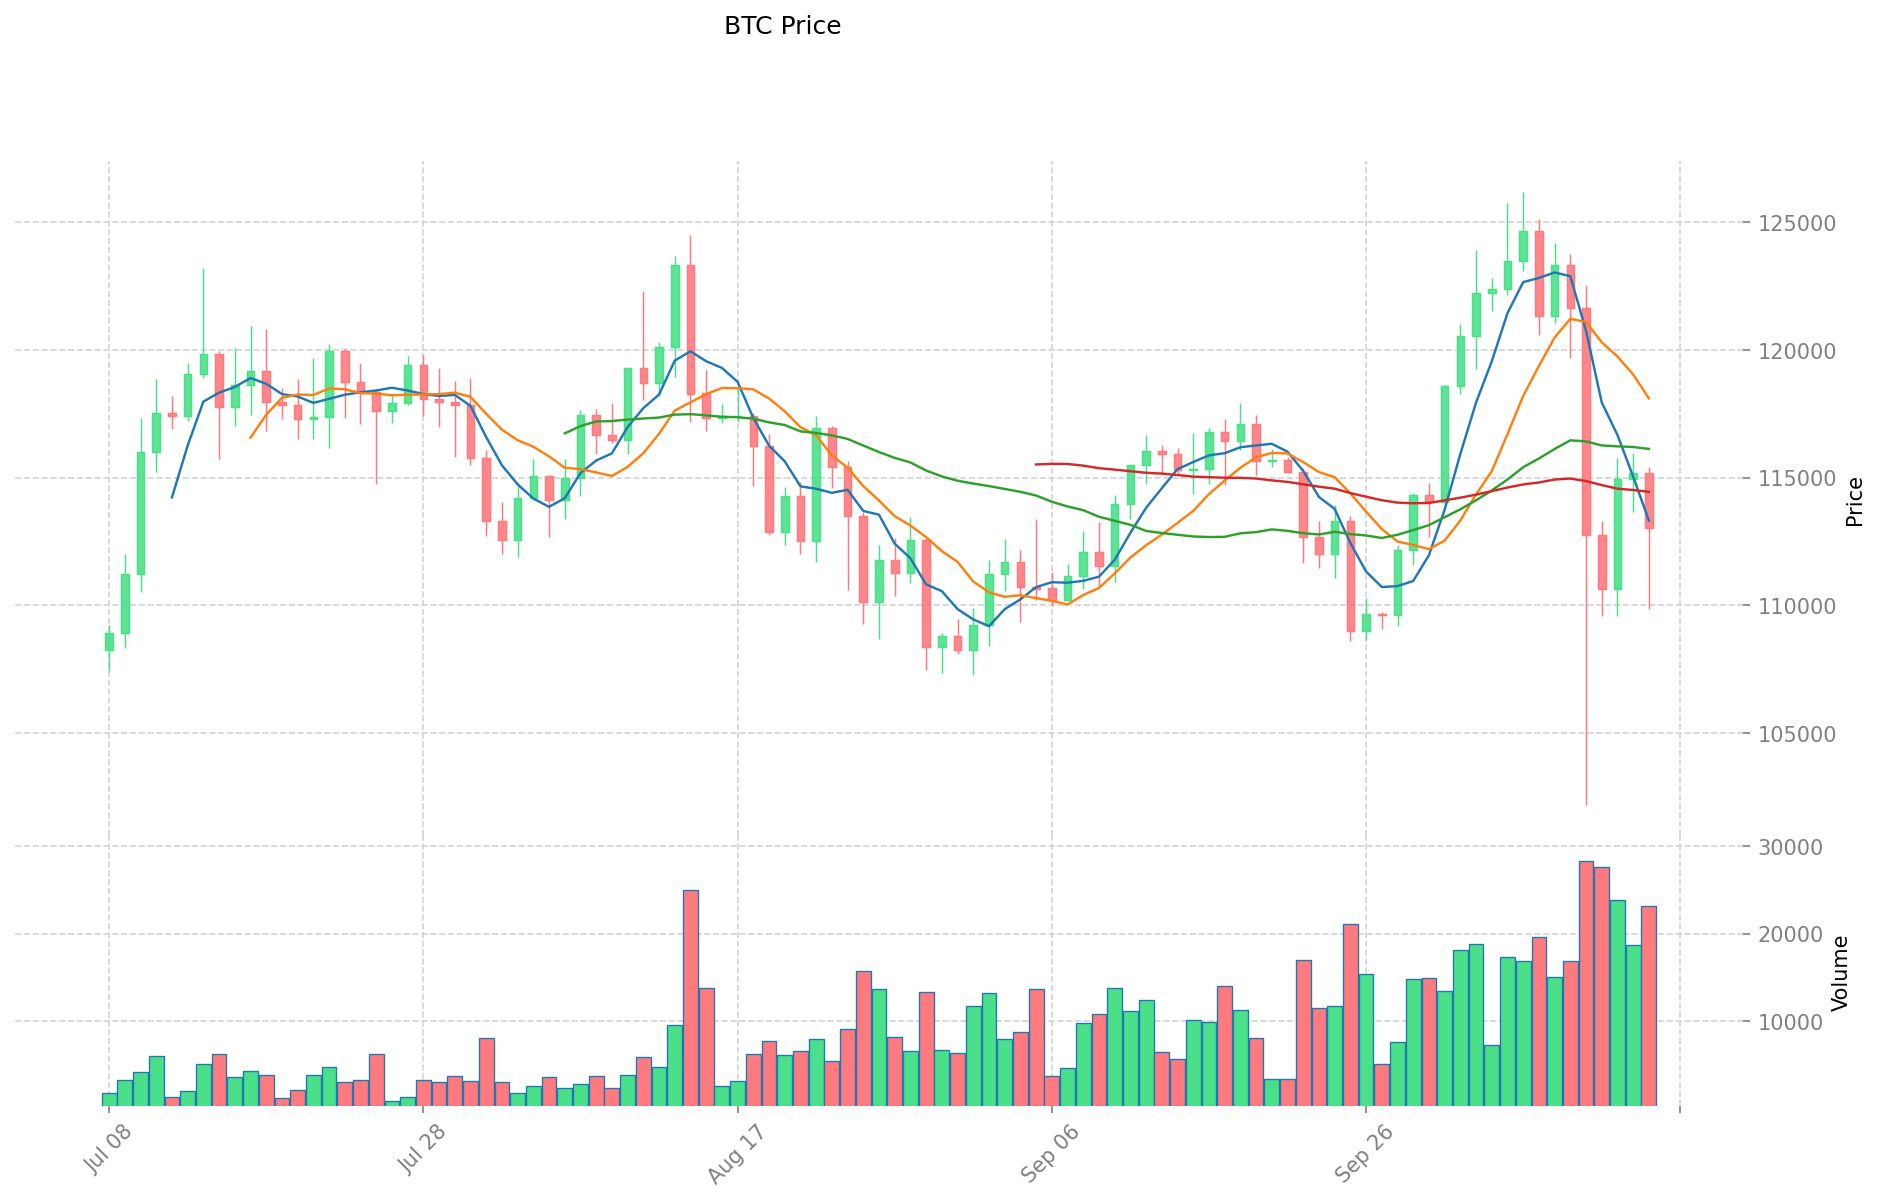
TRON (TRX) and Bitcoin (BTC) Historical Price Trends
- 2022: TRX launched decentralized stablecoin USDD, price increased significantly.
- 2024: BTC reached all-time high of $126,080 after spot ETF approvals, price surged.
- Comparative analysis: During the 2022-2025 market cycle, TRX rose from $0.05 to $0.32, while BTC increased from $20,000 to over $110,000.
Current Market Situation (2025-10-15)
- TRX current price: $0.3176
- BTC current price: $112,242.20
- 24h trading volume: TRX $8.97 billion vs BTC $2.59 trillion
- Market sentiment index (Fear & Greed Index): 34 (Fear)
Click to view real-time prices:
- Check TRX current price Market Price
- Check BTC current price Market Price
II. Core Factors Affecting the Investment Value of TRX vs BTC
Supply Mechanism Comparison (Tokenomics)
- TRX: Inflationary model with a large supply (over 94 billion coins) and no hard cap, using a DPoS consensus mechanism
- BTC: Deflationary model with capped supply (21 million), featuring halving events that reduce mining rewards approximately every 4 years
- 📌 Historical Pattern: BTC's halving cycles have historically triggered price rallies, while TRX's large supply creates sustained downward price pressure
Institutional Adoption and Market Applications
- Institutional Holdings: BTC is significantly preferred by institutional investors, while TRX has limited institutional backing
- Enterprise Adoption: TRX excels in cross-border payments and high-frequency transactions through USDT-TRC20, while BTC serves as a treasury reserve asset and settlement layer
- Regulatory Stance: BTC enjoys broader regulatory clarity globally, while TRX faces specific challenges including SEC lawsuits against TRON Foundation
Technical Development and Ecosystem Building
- TRX Technical Upgrades: Recent 60% transaction fee reduction to encourage network adoption, DPoS efficiency improvements
- BTC Technical Development: Lightning Network expansion for scalability, Taproot upgrade enhancing privacy and smart contract functionality
- Ecosystem Comparison: TRX leads in stablecoin transactions and DeFi TVL growth, while BTC dominates as a store of value with growing Layer-2 solutions
Macroeconomic Factors and Market Cycles
- Inflation Performance: BTC has stronger anti-inflationary properties due to fixed supply, while TRX has moderate inflation resistance
- Monetary Policy Impact: Both assets are influenced by interest rates and USD strength, with BTC showing stronger inverse correlation to monetary tightening
- Geopolitical Factors: International tensions increase demand for both, with BTC functioning as a macro hedge and TRX benefiting from cross-border transaction needs
III. 2025-2030 Price Prediction: TRX vs BTC
Short-term Prediction (2025)
- TRX: Conservative $0.1652 - $0.3177 | Optimistic $0.3177 - $0.4702
- BTC: Conservative $69,581 - $112,228 | Optimistic $112,228 - $160,485
Mid-term Prediction (2027)
- TRX may enter a growth phase, with an estimated price range of $0.2546 - $0.6666
- BTC may enter a bullish market, with an estimated price range of $112,003 - $184,654
- Key drivers: Institutional fund inflows, ETF, ecosystem development
Long-term Prediction (2030)
- TRX: Base scenario $0.6382 - $0.7421 | Optimistic scenario $0.7421 - $0.8460
- BTC: Base scenario $187,938 - $218,532 | Optimistic scenario $218,532 - $246,942
Disclaimer
TRX:
| 年份 | 预测最高价 | 预测平均价格 | 预测最低价 | 涨跌幅 |
|---|---|---|---|---|
| 2025 | 0.4702404 | 0.31773 | 0.1652196 | 0 |
| 2026 | 0.53188002 | 0.3939852 | 0.378225792 | 24 |
| 2027 | 0.6666229584 | 0.46293261 | 0.2546129355 | 45 |
| 2028 | 0.672085563198 | 0.5647777842 | 0.547834450674 | 77 |
| 2029 | 0.8658043431786 | 0.618431673699 | 0.43908648832629 | 94 |
| 2030 | 0.846014529620232 | 0.7421180084388 | 0.638221487257368 | 133 |
BTC:
| 年份 | 预测最高价 | 预测平均价格 | 预测最低价 | 涨跌幅 |
|---|---|---|---|---|
| 2025 | 160485.468 | 112227.6 | 69581.112 | 0 |
| 2026 | 166354.97148 | 136356.534 | 69541.83234 | 21 |
| 2027 | 184654.0183428 | 151355.75274 | 112003.2570276 | 34 |
| 2028 | 193205.61837261 | 168004.8855414 | 129363.761866878 | 49 |
| 2029 | 256459.4577789471 | 180605.251957005 | 133647.8864481837 | 60 |
| 2030 | 246941.5610008129365 | 218532.35486797605 | 187937.825186459403 | 94 |
IV. Investment Strategy Comparison: TRX vs BTC
Long-term vs Short-term Investment Strategies
- TRX: Suitable for investors focused on payment scenarios and ecosystem potential
- BTC: Suitable for investors seeking stability and inflation-resistant properties
Risk Management and Asset Allocation
- Conservative investors: TRX: 10% vs BTC: 90%
- Aggressive investors: TRX: 30% vs BTC: 70%
- Hedging tools: Stablecoin allocation, options, cross-currency portfolios
V. Potential Risk Comparison
Market Risk
- TRX: Higher volatility, susceptible to market sentiment shifts
- BTC: Macroeconomic factors, institutional investment flows
Technical Risk
- TRX: Scalability, network stability
- BTC: Mining concentration, security vulnerabilities
Regulatory Risk
- Global regulatory policies have different impacts on both assets
VI. Conclusion: Which Is the Better Buy?
📌 Investment Value Summary:
- TRX advantages: Strong ecosystem growth, high transaction speed, lower fees
- BTC advantages: Market dominance, institutional adoption, scarcity-driven value
✅ Investment Advice:
- Novice investors: Consider a small allocation to BTC for exposure to the crypto market
- Experienced investors: Diversify between BTC and TRX based on risk tolerance
- Institutional investors: Focus primarily on BTC with potential small TRX allocation for diversification
⚠️ Risk Warning: The cryptocurrency market is highly volatile. This article does not constitute investment advice. None
VII. FAQ
Q1: What are the main differences between TRX and BTC in terms of supply mechanism? A: TRX has an inflationary model with a large supply and no hard cap, using a DPoS consensus mechanism. BTC has a deflationary model with a capped supply of 21 million coins and features halving events that reduce mining rewards approximately every 4 years.
Q2: How do institutional adoption rates compare between TRX and BTC? A: BTC is significantly preferred by institutional investors and has broader regulatory clarity globally. TRX has limited institutional backing and faces specific challenges, including SEC lawsuits against the TRON Foundation.
Q3: What are the key technological developments for TRX and BTC? A: TRX has recently implemented a 60% transaction fee reduction and DPoS efficiency improvements. BTC has expanded its Lightning Network for scalability and implemented the Taproot upgrade, enhancing privacy and smart contract functionality.
Q4: How do TRX and BTC compare in terms of ecosystem building? A: TRX leads in stablecoin transactions and DeFi TVL growth, while BTC dominates as a store of value with growing Layer-2 solutions.
Q5: What are the long-term price predictions for TRX and BTC by 2030? A: For TRX, the base scenario predicts $0.6382 - $0.7421, with an optimistic scenario of $0.7421 - $0.8460. For BTC, the base scenario predicts $187,938 - $218,532, with an optimistic scenario of $218,532 - $246,942.
Q6: How should investors allocate their portfolio between TRX and BTC? A: Conservative investors might consider allocating 10% to TRX and 90% to BTC, while aggressive investors might opt for 30% TRX and 70% BTC. However, individual allocations should be based on personal risk tolerance and investment goals.
Q7: What are the primary risks associated with investing in TRX and BTC? A: TRX faces higher volatility and is susceptible to market sentiment shifts, while BTC is affected by macroeconomic factors and institutional investment flows. Both assets are subject to regulatory risks, with global policies potentially impacting their value differently.
Share
Content