The Liquidity Vacuum of Crypto's $19 Billion Collapse: When Market Makers Become Market Breakers
In my previous three analyses of the October 10-11 cryptocurrency liquidation cascade, I examined the oracle failures, infrastructure collapses, and potential coordinated attack vectors. Today, I turn to perhaps the most critical yet underappreciated aspect: how market makers—the entities supposedly providing market stability—became primary catalysts in creating an unprecedented liquidity vacuum that transformed a manageable correction into a $19 billion catastrophe.
Understanding Market Makers: Theory vs. Reality
Before examining the October collapse, it’s essential to understand what market makers are supposed to do. In traditional financial markets, market makers serve as intermediaries who continuously quote both bid and ask prices for financial instruments. They profit from the spread between these prices while providing a crucial service: liquidity.
The theoretical role of market makers includes:
- Continuous Price Discovery: Maintaining two-sided quotes that reflect fair market value
- Liquidity Provision: Ensuring traders can buy or sell at any time without significant price impact
- Volatility Dampening: Absorbing temporary supply/demand imbalances
- Market Efficiency: Arbitraging price differences across venues to maintain unified pricing
In cryptocurrency markets, market makers operate similarly but face unique challenges:
- 24/7 markets with no closing bell
- Fragmented liquidity across hundreds of exchanges
- Extreme volatility compared to traditional assets
- Limited regulatory oversight and obligations
- Technical infrastructure requirements for high-frequency trading
During normal market conditions, this system works reasonably well. Market makers earn modest spreads while providing essential liquidity. However, October 10-11 revealed what happens when incentives diverge from responsibilities.
The Timeline of Abandonment
The precision of market maker withdrawal during the October crash reveals coordinated behavior rather than panic. Here’s the detailed timeline of how liquidity evaporated:
20:00 UTC (4:00 PM ET): Trump’s formal announcement of 100% tariffs on Chinese imports hits social media. Bitcoin drops from $122,000. Market makers maintain positions but begin widening spreads—standard defensive behavior.
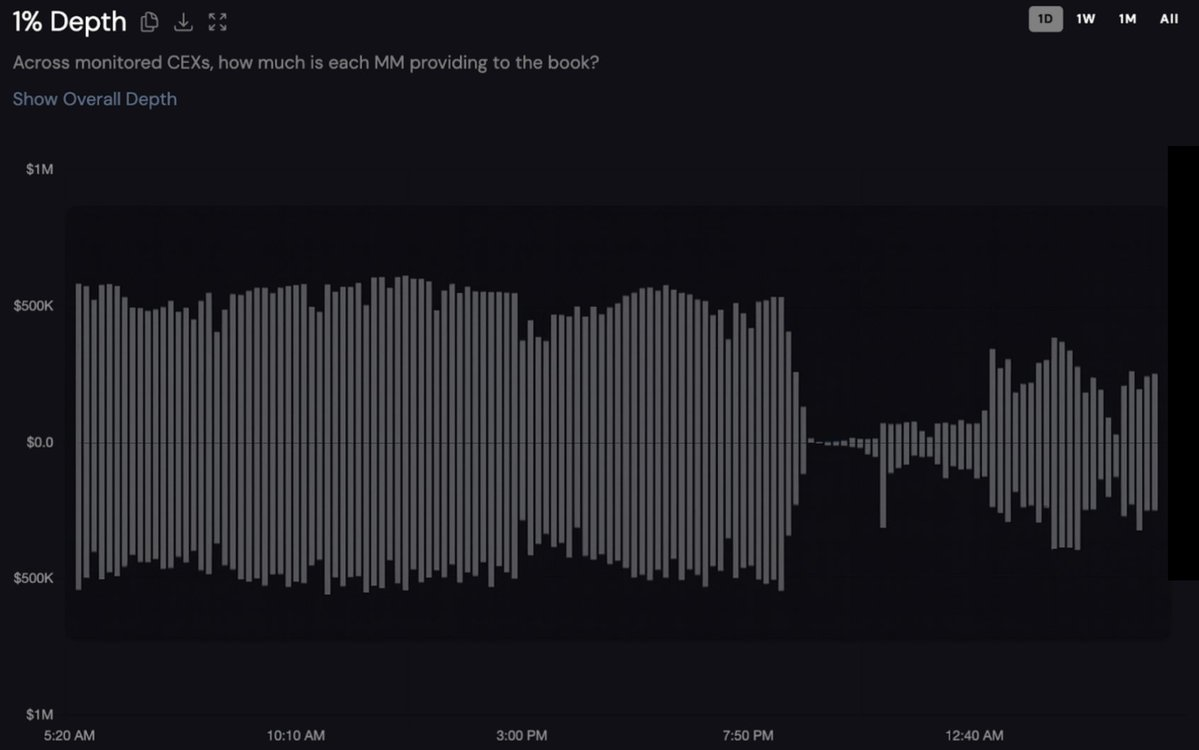
Binance 2-sided 1% depth chart for unnamed token_0 over the last 24 hours. Under x-axis are bids, Over are asks. From Coinwatch.
20:40 UTC: Real-time tracking data shows the beginning of catastrophic liquidity withdrawal. On one major token, market depth begins its plunge from $1.2M. https://x.com/coinwatchdotco/status/1977300622933377291?s=46&t=Bc8iVMf_sEJWxhSskA5TiA
21:00 UTC: The critical inflection point. At the start of US trading, macro conditions deteriorated sharply. Institutional participants pulled liquidity, bid-ask spreads widened, and order book depth thinned. This is when market makers shifted from defensive positioning to complete withdrawal.
21:20 UTC: Peak chaos. Nearly all tokens bottomed around this time during the global liquidation wave. Market depth on tracked tokens had fallen to just $27k—a 98% collapse. At $108,000, liquidity providers stopped defending prices, and some altcoins pushed down by 80%.
21:35 UTC: As the most intense selling exhausts, market makers begin cautiously returning. Within 35 minutes, aggregate CEX bid-ask depth recovered to >90% of pre-event levels—but only after maximum damage was inflicted.
The pattern reveals three critical insights:
- Market makers had 20-40 minutes of warning before complete withdrawal
- The withdrawal was synchronized across multiple firms
- Liquidity returned only after profitable re-entry points emerged
When Insurance Funds Fail: The ADL Cascade
When market makers abandon their posts and liquidations overwhelm order books, exchanges activate their last line of defense: Auto-Deleveraging (ADL). Understanding this mechanism is crucial to grasping the full scope of the October disaster.
How Centralized Exchange ADL Works
ADL represents the third and final tier in the liquidation hierarchy:
Tier 1 - Order Book Liquidation: When a position falls below maintenance margin, the exchange attempts to close it through the order book. If successful at a price better than the bankruptcy price (where margin = 0), excess funds flow to the insurance fund.
Tier 2 - Insurance Fund: If order book liquidity is insufficient, the insurance fund absorbs losses. This fund, built from liquidation profits during normal times, acts as a buffer against bad debt.
Tier 3 - Auto-Deleveraging: When the insurance fund cannot cover losses, exchanges forcibly close profitable positions on the opposite side.
The ADL Ranking System
Binance’s ADL mechanism uses a sophisticated ranking formula:
ADL Ranking Score = Position P&L % × Effective Leverage
Where:
Position P&L % = Unrealized Profit / abs(Position Notional)
Effective Leverage = abs(Position Notional) / (Account Balance - Unrealized Loss + Unrealized Profit)
Bybit’s approach is similar but includes additional safeguards. They display a 5-light indicator showing your percentile ranking:
- 5 lights = Top 20% (highest priority for ADL)
- 4 lights = 20-40%
- 3 lights = 40-60%
- 2 lights = 60-80%
- 1 light = Bottom 20% (lowest priority)
The cruel irony: the most successful traders—those with highest profits and leverage—get forcibly closed first.
October’s ADL Catastrophe
The scale of ADL activation on October 10-11 was unprecedented:
- Hyperliquid: Activated cross-margin ADL for the first time in over 2 years, affecting 1,000+ wallets
- Binance: Widespread ADL activation
- Bybit: Reported over 50,000 short positions deleveraged, totaling $1.1 billion
- BitMEX: The exception—only 15 contracts ADL’d due to massive insurance fund
The timing correlation with market maker withdrawal is damning. As order books emptied between 21:00-21:20 UTC, liquidations couldn’t clear normally, forcing immediate insurance fund depletion and ADL activation.
Case Study: The Cascade in Action
Consider what happened to a typical hedged portfolio during those critical 35 minutes:
21:00 UTC: Trader holds:
- Long BTC: $5M at 3x leverage
- Short DOGE: $500K at 15x leverage (profitable hedge)
- Long ETH: $1M at 5x leverage
21:10 UTC: Market makers withdraw. DOGE crashes, short becomes highly profitable. But this triggers ADL due to high leverage + profit combination.
21:15 UTC: Forced closure of DOGE short via ADL. Portfolio now unhedged.
21:20 UTC: Without the hedge, BTC and ETH longs liquidate in cascade. Total loss: entire portfolio.
This pattern repeated thousands of times. Sophisticated traders with carefully balanced positions saw profitable hedges forcibly closed via ADL, leaving naked exposure that subsequently liquidated.
Why Market Makers Failed: The Incentive Problem
The synchronized withdrawal of liquidity reveals a fundamental structural issue. Market makers faced several incentives to abandon markets:
- Asymmetric Risk/Reward
During extreme volatility, the potential losses from maintaining quotes far exceed the spread profits. A market maker quoting $1M depth might earn $10K in spreads during normal times but face $500K in losses during a cascade.
- Information Advantage
Market makers see aggregate order flow and positioning. When they detected the massive long bias (87% of positions were long), they knew which direction the cascade would go. Why provide bids when you know a tsunami of sell orders is coming?
- No Legal Obligations
Unlike traditional exchanges where designated market makers have regulatory requirements, crypto market makers can withdraw at will. There are no penalties for abandonment during crisis.
- Arbitrage Opportunities
Data from the crash shows market makers who withdrew from providing quotes pivoted to arbitrage between exchanges. With prices diverging by $300+ between venues, arbitrage was far more profitable than market making.
The Feedback Loop of Destruction
The interaction between market maker withdrawal and ADL created a devastating feedback loop:
- Initial shock (Trump tariff announcement) triggers selling
- Market makers withdraw sensing cascade potential
- Liquidations cannot clear through empty order books
- Insurance funds rapidly deplete absorbing bad debt
- ADL activates, forcibly closing profitable positions
- Deleveraged traders must re-hedge, adding sell pressure
- More liquidations trigger, returning to step 3
This loop continued until leveraged positions were essentially extinct. The data shows open interest across the market fell by approximately 50% in hours.
The Uncomfortable Truth About Market Structure
The October 10-11 catastrophe wasn’t primarily about excessive leverage or regulatory failures. It was about misaligned incentives in market structure. When those responsible for maintaining orderly markets can profit more from chaos than stability, chaos becomes inevitable.
The timeline data reveals market makers didn’t panic—they executed a coordinated withdrawal at the optimal moment to minimize their losses while maximizing subsequent opportunities. This rational behavior under current incentive structures produced irrational outcomes for the market as a whole.
Rebuilding Trust Through Accountability
The October 2025 liquidity crisis exposed cryptocurrency markets’ critical weakness: voluntary liquidity provision fails precisely when involuntary provision is most needed. The $19 billion in liquidations wasn’t just overleveraged traders getting caught—it was the predictable result of a system where market makers have all the privileges of liquidity provision but none of the responsibilities.
The path forward requires acknowledging that pure laissez-faire market making doesn’t work during stress. Just as traditional markets evolved from the chaos of unregulated trading to include circuit breakers, position limits, and market maker obligations, crypto markets must implement similar safeguards.
The technical solutions exist:
- Graduated obligation systems that tie benefits to responsibilities
- Insurance funds sized for actual risks, not optimistic projections
- ADL mechanisms with circuit breakers to prevent cascades
- Real-time transparency in market maker behavior
What’s missing is the will to implement them. Until crypto exchanges prioritize long-term stability over short-term fee maximization, we’ll continue experiencing these “unprecedented” events with depressing regularity.
The 1.6 million liquidated accounts on October 10-11 paid the price for this structural failure. The question is whether the industry will learn from their sacrifice or simply wait for the next cohort of traders to discover that when crisis arrives, the market makers they depend on will vanish like smoke, leaving only cascading liquidations and forcibly closed profitable positions in their wake.
Analysis based on available market data, cross-venue price comparisons, and established patterns in market behavior. The views expressed are mine alone, informed by but not representing any entity.
Disclaimer:
- This article is reprinted from [yq_acc]. All copyrights belong to the original author [yq_acc]. If there are objections to this reprint, please contact the Gate Learn team, and they will handle it promptly.
- Liability Disclaimer: The views and opinions expressed in this article are solely those of the author and do not constitute any investment advice.
- Translations of the article into other languages are done by the Gate Learn team. Unless mentioned, copying, distributing, or plagiarizing the translated articles is prohibited.
Related Articles

The Future of Cross-Chain Bridges: Full-Chain Interoperability Becomes Inevitable, Liquidity Bridges Will Decline

Solana Need L2s And Appchains?

Sui: How are users leveraging its speed, security, & scalability?

Navigating the Zero Knowledge Landscape

What is Tronscan and How Can You Use it in 2025?
