Vaults, Yields, and the Illusion of Safety - Part 1: The Real World Benchmark
Vaults are one of those ideas in crypto that everyone thinks they understand, mostly because they look simple. But simplicity is deceptive. Under the surface, vaults have quietly become one of the most misunderstood yet strategically important primitives in the entire ecosystem.
During DeFi Summer, “vault” was just a clever UI around automated yield farming. Yearn took a messy, high-touch behavior - hopping between farms, compounding governance tokens - and wrapped it in something that felt like magic. Deposit here, and the strategy does the work. It was an internet-native abstraction, and it worked.
But 2025 is a different world.
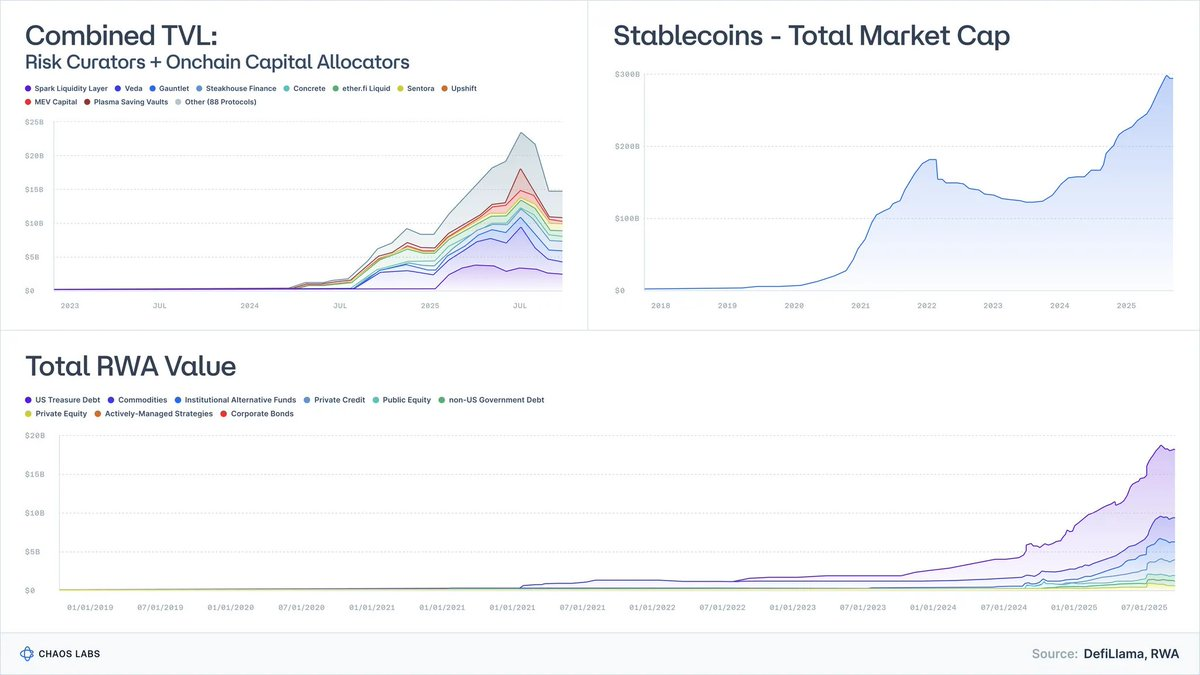
Tokenized Treasuries have evolved from experiments measured in tens of millions to nearly $9 billion in AUM, with BlackRock, Franklin, and Société Générale now active participants.
RWAs excluding stablecoins sit in the tens of billions.
Stablecoins themselves have surpassed $300 billion, and the sophistication of issuers has grown dramatically.
Risk Curators and Onchain Allocators, an industry that barely registered a few years ago, now manage $20B+ across nearly 100 firms.
The idea that vaults are just “yield machines” is outdated. Vaults are evolving into fund wrappers, serving as programmable analogues of money-market funds, structured credit, and, increasingly, hedge-fund strategies.
And here’s the dangerous misconception:
Most vaults are marketed as yield instruments. But economically, they are risk products.
The collapse of Stream, Elixir, and others made that clear. When the industry treats structured credit as a dollar-equivalent, the outcome is predictable: unmanaged risk, cascading depegs, and systemic fragility in lending protocols.
This essay is an attempt to reset the mental model: what vaults actually represent, how they map to real-world asset classes, and why “low-risk DeFi” is not a meme but the next frontier of global financial adoption.
1. Vaults Are Just Portfolios With APIs
Strip away the UI and marketing, and a vault reduces to a simple idea:
a portfolio construction engine wrapped in an API.
- Assets go in (stablecoins, ETH, RWAs).
- A strategy runs (lend, borrow, hedge, lever, farm, sell volatility, underwrite credit).
- A programmable interface exposes deposits and withdrawals; sometimes with predictable liquidity, sometimes not.
That’s all a vault is.
If someone in traditional finance handed you a fund term sheet, you’d immediately ask:
- Is this cash? Credit? Equity? Something exotic?
- What’s the liquidity profile - daily, weekly, quarterly?
- And what happens to my capital in a tail event?
Crypto skipped this step entirely. We talk about APY instead of risk class.
And on a DeFi frontend, five radically different strategies all collapse into the same cheerful card:
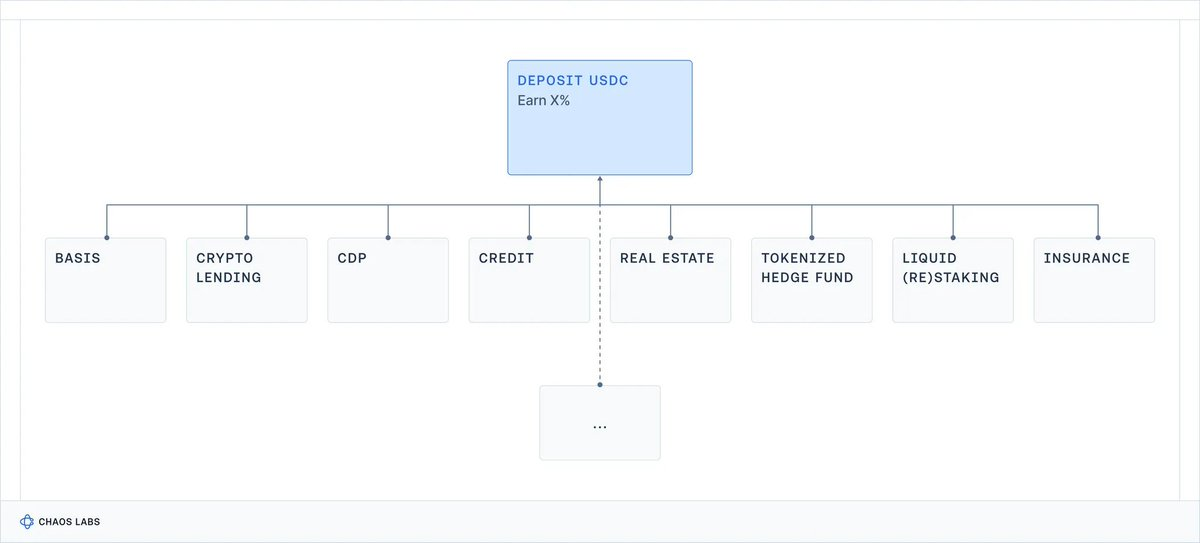
Vaults are gateways to anything onchain.
What’s missing is the essential part: what risk am I underwriting?
Contract risk? Counterparty risk? Basis risk? Leverage risk? Credit risk? All of the above?
Ultimately, this opacity comes at a price: retail users can sign up for risks they don’t know about or don’t understand and incur unexpected losses (that may even draw the attention of regulators); institutional players take one look and walk away, discouraged by the lack of professionalism and transparency standards.
Moreover, utilizing Yield as the only competitive benchmark has another devastating effect for risk management: protocols and risk curators take more and more risk, in the attempt of out-compete each other.
As crypto enters its institutional era, that has to change.
2. What Are You Actually Being Paid For? A Real World Baseline
If we want to understand DeFi vault yields, we need a baseline:
What has the real world historically paid for different kinds of risk?
For almost a century, researchers have compiled data on core financial asset classes.
Aswath Damodaran maintains a canonical U.S. series for stocks, bonds, and bills going back to 1928, while the Global Investment Returns Yearbook tracks long-run returns across major countries since 1900.
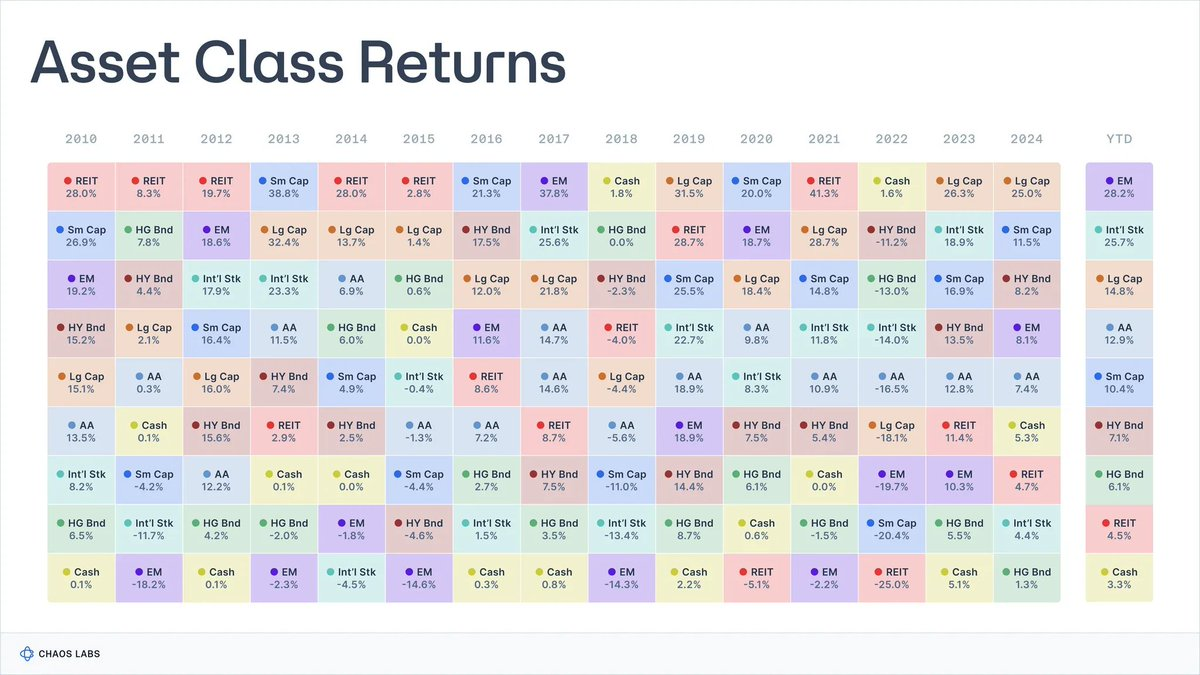
Source: novelinvestor.com
Across these datasets, the picture is surprisingly consistent:
- Stocks (S&P 500): ~9.9%
- Small-Cap Stocks: ~11.7%
- High-Yield Corporate Bonds: ~7.8%
- Investment-Grade Bonds: ~4.5%
- Cash / T-Bills: ~3.3%
- Real Estate: ~4.2%
- Gold: ~5%
Inflation over this period averaged roughly 3%, so real returns are about 3 percentage points lower. These numbers are not precise forecasts of the future, but they are a rough menu of what’s economically plausible over long horizons.
Each of those returns come with a series of risks and tradeoffs that the respective holders are underwriting.
2.1 Cash / T-Bills: Getting Paid to Wait
What it is
In practice, the closest thing the financial system has to a “risk-free” benchmark (Short-term U.S. government debt, money-market funds).
Historical return
- ~3.3% nominal, (0-1% real after inflation).
What you’re paid for: essentially only for the time value of money, given the virtual absence of credit risk and the minimal duration risk.
Tradeoffs: inflation quietly erodes returns and purchasing power; after fees and friction, long-run real returns hover near zero.
In essence, these are great for parking cash, not for compounding wealth.
2.2 Bonds: Getting Paid to Lend
What it is
Debt issued by governments and corporations, of varying quality. You are lending money in exchange for coupons and principal repayment.
Historical return
- ~4-4.6% nominal for investment-grade bonds;
- ~6-8% nominal for high-yield bonds (”junk bonds”).
What you’re paid for:
- Credit risk: the chance the borrower defaults or is impaired (higher in “junk bonds”);
- Duration risk: sensitivity to changes in interest rates;
- Liquidity risk, especially in off-the-run or lower-grade bonds.
Tradeoffs: bond portfolios can underperform dramatically when rates rise (cyclical sensitivity, e.g. 2022’s historically bad bond returns), real returns can be low or negative when inflation spikes and credit events (restructuring, defaults) can cause permanent capital loss.
“Bonds” merge under a single label a whole universe of financial instruments with varying risks and returns: assessing the economic health of the debtor is fundamental in defining the exact risk profile.
2.3 Equities: Getting Paid for Growth Volatility
What it is
Ownership of businesses. Exposure to earnings, innovation, and long-run economic growth.
Historical return
- U.S. equities (S&P 500): ~9.9-10% nominal, ~6.5-7% real.
What you’re paid for:
- Business risk: companies can fail;
- Earnings cycles: profits rise and fall with the economy, dividends contributing to overall returns may dwindle;
- Volatility and drawdowns: relatively large mark-to-market swings are normal, even for advanced economies.
Tradeoffs: even if over long horizons global equities have an established pattern of being a better alternative to bonds and bills, multi-year corrections of 30–50% are not anomalies (e.g. Japan’s lost decades, or Europe 2000 - 2018), especially when accounting for inflation.
2.4 Real Estate: Income + Leverage + Local Risk
What it is
Income-producing property: residential, commercial, logistics, etc.
Historical return
- ~4-4.5% nominal long-term average for broad U.S. real-estate indices, 1-2% real.
What you’re paid for:
- Income risk and economic cycles: returns depend on the tenants ability to keep paying regularly rents, which can dwindle with economic cycles;
- Local economy risks: exposure to specific cities, regions, and sectors;
- Leverage and volatility risk: mortgages and debt financing amplify both returns and losses;
- Liquidity risk: real estate and many real-estate-linked instruments are slow and costly to trade, especially in stress.
Tradeoffs:
- you can’t instantly “mark and exit” a building; selling or refinancing takes weeks/months, and even listed REITs can gap down hard in stress;
- downturns in rates, credit, or local demand (e.g. WFH crushing office) can hit both income and valuations at the same time;
- when rates rise or lenders pull back, rolling debt can become expensive;
- portfolios are often overweight specific geographies or property types.
In practice, even though real estate has historically been a good investment to fight off inflation, it’s a complex and illiquid field that cannot be treated or paid as cash equivalents.
2.5 Private Equity & Venture: Illiquidity + Complexity Premium
What it is
Illiquid, long-duration investments in private companies and projects, such as buyouts and growth equity; early-stage venture capital or distressed and special situations.
Historical return
- PE: mid-teens net IRR in many vintages (but highly cyclic)
- VC: 20-30%+ for top quartile managers
However, the data present extreme variance: median performance is much closer to low single-digit real returns once fees and survivorship bias are accounted for.
What you’re paid for
- Long Term Illiquidity: capital locked for 7-12 years
- Complexity: bespoke deals, governance, and structuring
- Manager skill: huge dispersion between managers and vintages
- Information asymmetry: specialized access and diligence
- Higher principal risk: venture investments are highly dependent on execution and economic cycles; they have a high risk of incurring in principal losses.
Tradeoffs: capital is locked for long periods of times; often with no secondary market. Moreover, many funds underperform public markets when accounting of fees, despite the higher risk.
3. No Free Lunch: The Yield Ladder
When you put all this historical data together, a simple truth emerges:
There is no asset class in the real world that pays high yields without high risk somewhere in the stack.

A useful mental model for interpreting vault yields is a yield ladder:
- 3-5% → Cash, T-bills, short-term government paper, ultra-conservative credit
- 5-8% → Investment-grade bonds, conservative credit portfolios
- 8-12% → High-yield bonds, riskier credit, equity-light strategies, some levered carry
- 12-20%+ → Private equity, venture, hedge-fund strategies, opportunistic credit, complex structured products
Over a century of market data, this ladder has been remarkably resilient through wars, hyperinflation, tech booms, and rate regimes.
Putting a portfolio on-chain doesn’t magically break it. So whenever you see a DeFi vault, ask two questions:
- does the advertised risk match the promoted yield?
- where does the yield come from?
4. Conclusion: The Right Mental Model for Vault Yields
Underneath the marketing and the UI, the reality is straightforward:
- A vault is not anymore an autocompounding food-farm, but rather a portfolio with an API;
- Its yield is the price of the risks it underwrites;
- And over a century of market data, the menu of plausible yields for a given risk has been remarkably stable.
Cash-like instruments live in the low single digits nominal and almost zero real returns.
Investment-grade credit pays a bit more for duration and default risk.
High-yield credit and equity push you into high single digits and low teens.
Private equity, venture, and hedge-fund strategies are the only places that have historically delivered sustained mid-teens and above, and they come with illiquidity, opacity, and very real chances of permanent loss.
Putting these portfolios on-chain does not change the relationship between risk and rewards. On today’s DeFi frontends, five completely different risk profiles can all show up as the same friendly card: “Deposit USDC, Earn X%”, with little or no indication of whether you’re underwriting cash, IG credit, junk credit, equity, or hedge-fund risk.
That’s bad enough for individual users, who can end up unknowingly insuring complex credit products or leverage stacks they don’t understand.
But it also has a systemic consequence: the path of least resistance is for every product in a given “category” to creep toward the maximum risk of that bracket to stay competitive on yield. Safer configurations look “underperforming” and get ignored. Curators and protocols that quietly reach a bit further for credit, leverage, or basis are rewarded, right up until a Stream- or Elixir-style event reminds everyone what they were actually underwriting.
The yield ladder is therefore more than a pedagogical tool. It’s the beginning of a risk language the industry is currently missing. If we can consistently answer two questions for every vault:
- Which rung of the ladder does this belong to?
- What risks is this yield compensating me for (contract, credit, duration, liquidity, directional)?
then we can judge performance within a risk class instead of turning the entire ecosystem into a single, undifferentiated APY race.
In the next parts of this series, we’ll take this framework and apply it directly to crypto. First, we’ll map today’s major vaults and blowups onto the ladder to see what their yields were really telling us. Then we’ll zoom out and ask what needs to change: labels, standards, curator practices, and system design.
Disclaimer:
- This article is reprinted from [omeragoldberg]. All copyrights belong to the original author [omeragoldberg]. If there are objections to this reprint, please contact the Gate Learn team, and they will handle it promptly.
- Liability Disclaimer: The views and opinions expressed in this article are solely those of the author and do not constitute any investment advice.
- Translations of the article into other languages are done by the Gate Learn team. Unless mentioned, copying, distributing, or plagiarizing the translated articles is prohibited.
Share
Content


Related Articles

The Future of Cross-Chain Bridges: Full-Chain Interoperability Becomes Inevitable, Liquidity Bridges Will Decline

Solana Need L2s And Appchains?

Sui: How are users leveraging its speed, security, & scalability?

Navigating the Zero Knowledge Landscape

What is Tronscan and How Can You Use it in 2025?