Author: Frank, PANews
Whenever the market enters a state of uncertainty, there are always people trying to predict the next trend using a “marking the boat to seek the sword” style of historical retrogression. In such cases, people often see history repeating itself through these theories and charts, automatically overlaying future market movements with past segments for validation.
This kind of overlap seems to have a magical effect and is often validated. A blogger claims that this prediction method can achieve an accuracy rate of 75% to 80%.
Is this “marking the boat to seek the sword” style of price prediction helping the market identify phases, or is it just packaging noise as prophecy?
From “Tick-Tock Fractal” to “Historical Rhyme”
The peak operation predicting the market top in October 2025 was by an analyst named CryptoBullet. He created an analysis method called “tick-tock” fractals, which, starting from May 2025, predicted that Bitcoin’s price would peak in October.
Ultimately, this model successfully predicted the end of the bull market. However, CryptoBullet forecasted a top of $150,000, while the actual peak only reached about $126,000.
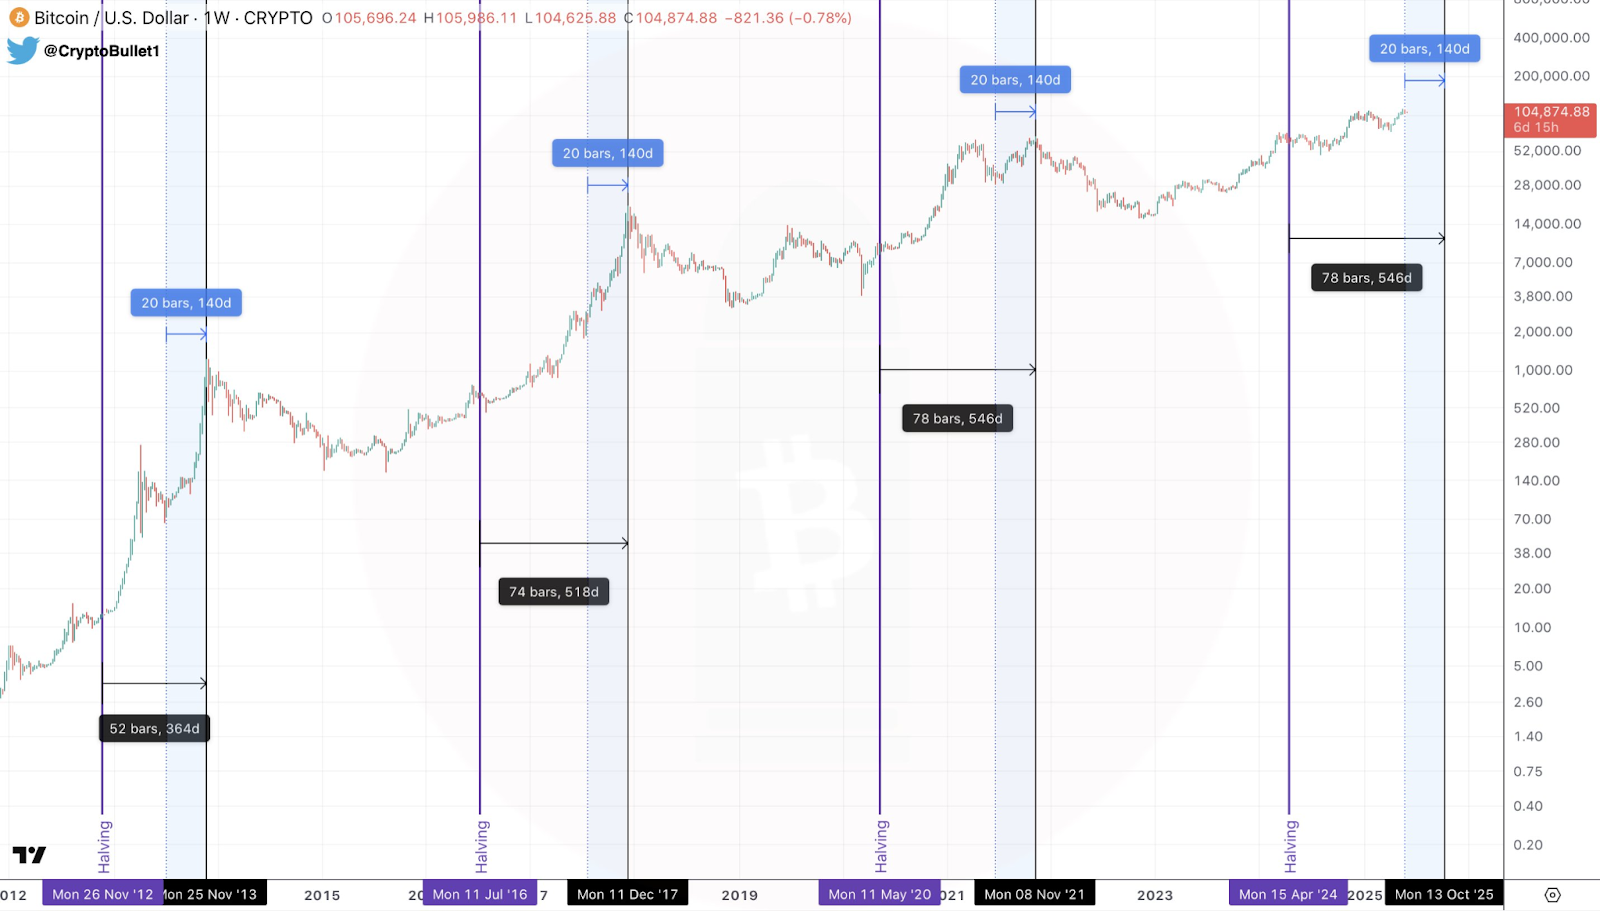
Based on the principles of his prediction model, such an outcome was expected. His main logic is: in previous cycles, a certain number of days after halving, the market often reaches a top. When the market enters a similar window, and with the same time intervals and price development, October could see a peak of $150,000. The most critical parameter in this logic is the time cycle, so the prediction of timing was relatively accurate, but the price prediction missed the mark.
Another example is KillaXBT, whose core idea is: history does not repeat exactly but often “rhymes.” He combines time cycles, historical pivot windows, and structural symmetry to adapt to the current market.
For example, he doesn’t force all time cycles into a fixed ratio, emphasizing that certain events happen at specific times. Instead, he compares the current price window and trend with a certain phase in historical trends, then makes a fuzzy prediction of the possible future movement.
This kind of prediction does not involve very specific prices or exact timing. It’s mainly about judging whether the market will rise or fall next.
KillaXBT claims that this prediction method can achieve an accuracy of 75% to 80%.
PANews has reviewed several of his recent predictions. For example, in December 2025, he analyzed that the price trend at that time was highly similar to 2021, predicting a possible bottom around $80,000 and then breaking through $90,000.
The actual trend saw the price not falling below $80,000 but eventually breaking past $90,000, reaching nearly $98,000. Although the price forecast was not precise, the trend was indeed similar to his simulation of the 2021 cycle.
In January 2026, based on another prediction method, KillaXBT indicated that, based on the statistical pattern over the past seven months, the market tends to decline about 8% within two weeks after the 14th of each month.
In reality, this prediction was also quite accurate. After a brief peak on January 15, the market indeed entered a rapid decline, with a maximum drop of over 38%.
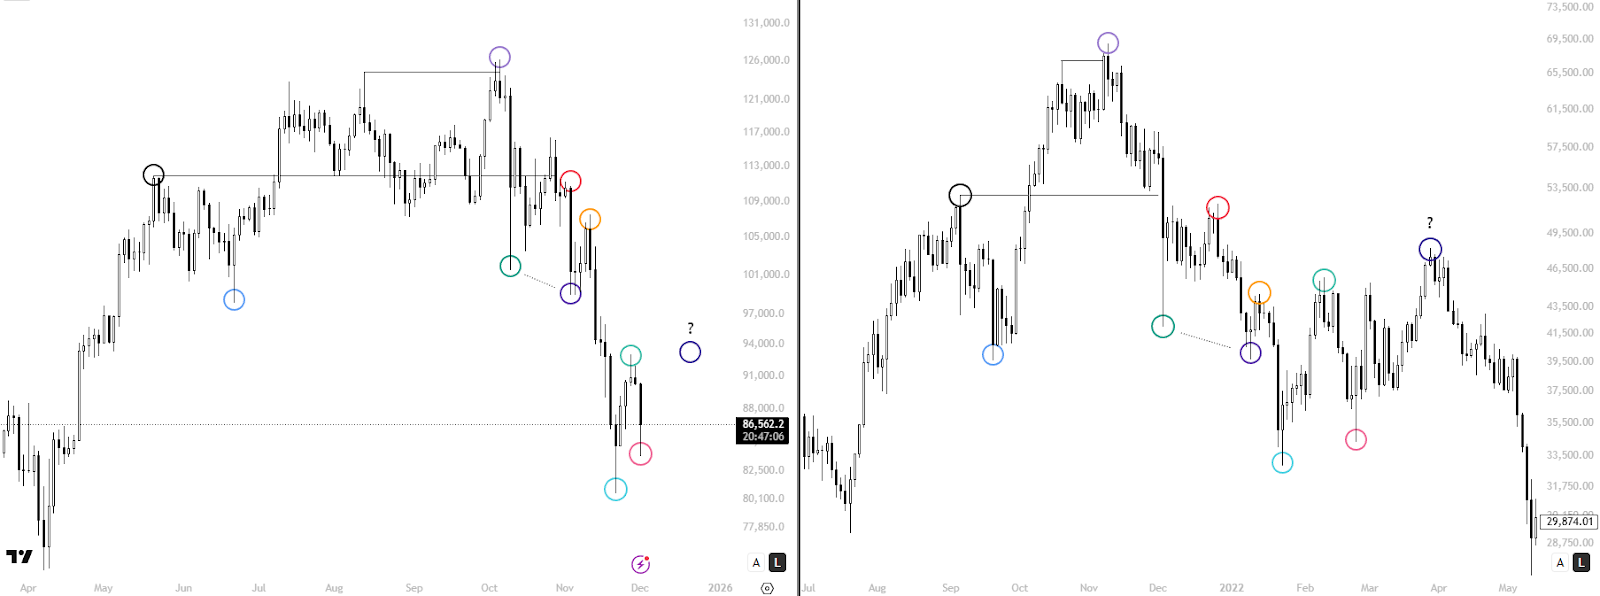
In February 2026, he again predicted that the trend would resemble 2022, possibly surging once more before breaking below $60,000 to form a bottom zone. This prediction has not yet been fully validated, but the recent rebound to around $74,000 did verify some of his forecasted trend lines.
At first glance, KillaXBT’s predictions seem fairly accurate, which has earned him a lot of attention and followers.
Mysticism or Science? The Three Main Logics Behind the High Success Rate of “Marking the Boat to Seek the Sword”
But the more practical question is: why are these “marking the boat to seek the sword” predictions often accurate? Is it mysticism or is there some scientific basis?
First: History does rhyme, but the essence of rhyming is due to liquidity and market heat, which cause market structures to be similar. For example, in “Wyckoff Method,” the market is divided into four stages: accumulation, markup, distribution, and markdown.
The repeated evolution of markets is driven by recurring market sentiment—fear turning into greed, and greed turning back into fear.
Second: The effectiveness of these predictions is not exclusive to “marking the boat to seek the sword.” Most commonly used technical indicators can achieve similar predictive effects. Looking back at how indicators like MACD, RSI, and trendlines perform on historical data, you’ll find they often give early warnings at market tops and bottoms.
However, firstly, these indicators are too familiar to traders, lacking a sense of mystery. Secondly, compared to the intuitive visual cues of “marking the boat,” these indicators do not directly show specific trend structures (e.g., a rise followed by a fall). Still, people naturally prefer this straightforward, simple expression.
Third: The luck bias after many predictions. In the book “The Drunkard’s Walk,” there’s an example: if an infinite number of monkeys type randomly on typewriters, one of them will inevitably produce the entire “Iliad” verbatim. This doesn’t mean analysts are just randomly guessing; it illustrates that on social media, many predictions are made daily, and those that are wrong are either ignored or quietly deleted. The successful cases that remain are largely due to luck bias. Influencers aim for traffic, while traders focus on real profits and losses.
“Marking the boat to seek the sword” predictions in crypto are not new; years ago, many similar theories emerged. For example, TechDev overlays Bitcoin’s monthly chart with the 2013 cycle and 1970s gold trends, projecting a top between $200,000 and $390,000; PlanB uses stock-to-flow and floor models, extrapolating halving rhythms to $100,000. Many analysts directly apply the local ranges of 2017 and 2021 to current trends.
By this cycle, almost all these predictions have failed, and they’ve become less talked about. When old prophets are phased out, new mystics appear with fresh theories.
Forecasting is not the same as trading strategy; practical application has critical flaws.
Let’s revisit the earlier examples.
CryptoBullet’s prediction of a $150,000 top in October 2025 is just a rough timing estimate, with an inaccurate price forecast. As a trading strategy, such a judgment has limited practical value. It’s hard to open a short position in early October based solely on “top in October,” because it doesn’t specify entry points or clear invalidation conditions. Acting too early might result in losses during the final rally; waiting for actual weakness signals makes the prediction more of a post-hoc validation of “rough timing” rather than a usable trading system.
Similarly, KillaXBT’s December prediction mainly offers directional guidance, not precise entry points. He suggests “the trend will likely bottom out first and then break upward,” but doesn’t specify whether to buy near $82,000, $80,000, or $78,000, nor does he specify at what point a breakdown invalidates the analogy. For medium- to long-term investors, such guidance can help hold positions without panic selling during declines. But for traders needing precise entries and exits, it lacks critical execution details.
His January prediction might be the most accurate, but since the price only started declining after the 15th, following this prediction blindly could have resulted in stop-loss hits during the upward move. Moreover, the prediction structure lacks specific price levels, making it impossible to set stop-loss or take-profit points based solely on this forecast.
Overall, these “marking the boat to seek the sword” predictions are more like phase recognition tools rather than directly repeatable trading strategies. They can occasionally help identify risk zones and sentiment shifts, providing some inspiration in vague directions. But once packaged as high-confidence prophecies, the problems become evident quickly.
History rhymes, but it doesn’t copy-paste.
For ordinary investors, what’s truly valuable isn’t a “divine chart,” but the underlying emotions, liquidity, and structural changes these charts hint at. The real danger lies in treating these vague phase judgments as precise trading commands.