 Trusted Editorial content, reviewed by leading industry experts and seasoned editors. Ad Disclosure
XRP has retraced below the $1.50 level, reflecting renewed volatility and sharper price swings across the broader cryptocurrency market. After a brief period of relative stability, the asset is now facing increased uncertainty, with traders reassessing short-term direction as momentum begins to fade.
Trusted Editorial content, reviewed by leading industry experts and seasoned editors. Ad Disclosure
XRP has retraced below the $1.50 level, reflecting renewed volatility and sharper price swings across the broader cryptocurrency market. After a brief period of relative stability, the asset is now facing increased uncertainty, with traders reassessing short-term direction as momentum begins to fade.
Related Reading: Grayscale Doubles Down On Ethereum: $44.6M Staked In Fresh ETH AllocationBeyond price action, on-chain and derivatives data are signaling a more subtle but important shift in market dynamics. According to a recent report by CryptoQuant analyst Arab Chain, data from Binance’s XRP Institutional Accumulation Model reveals a notable divergence between price behavior and underlying investor activity.
The index is currently in negative territory, with a reading of approximately -0.14, while XRP continues to trade near $1.46. This discrepancy is significant. Historically, positive readings in this model have been associated with strong institutional inflows and sustained upward trends. In contrast, negative values suggest weak accumulation or even early signs of distribution among larger market participants.
In this context, XRP’s ability to maintain relatively elevated price levels despite declining institutional interest may indicate a temporary equilibrium. However, the absence of strong accumulation flows raises questions about the sustainability of current price levels if broader market conditions remain unstable.
Institutional Signals Point to Equilibrium, Not Conviction
The report highlights that the historical behavior of the XRP Institutional Accumulation Model provides important context for current conditions. Periods of strongly positive readings have typically aligned with or preceded sustained upward trends, reflecting strategic positioning by institutional participants building long-term exposure. In contrast, negative readings—such as the current -0.14 level—tend to signal weak accumulation or the early stages of distribution, where large players are either inactive or gradually reducing exposure.
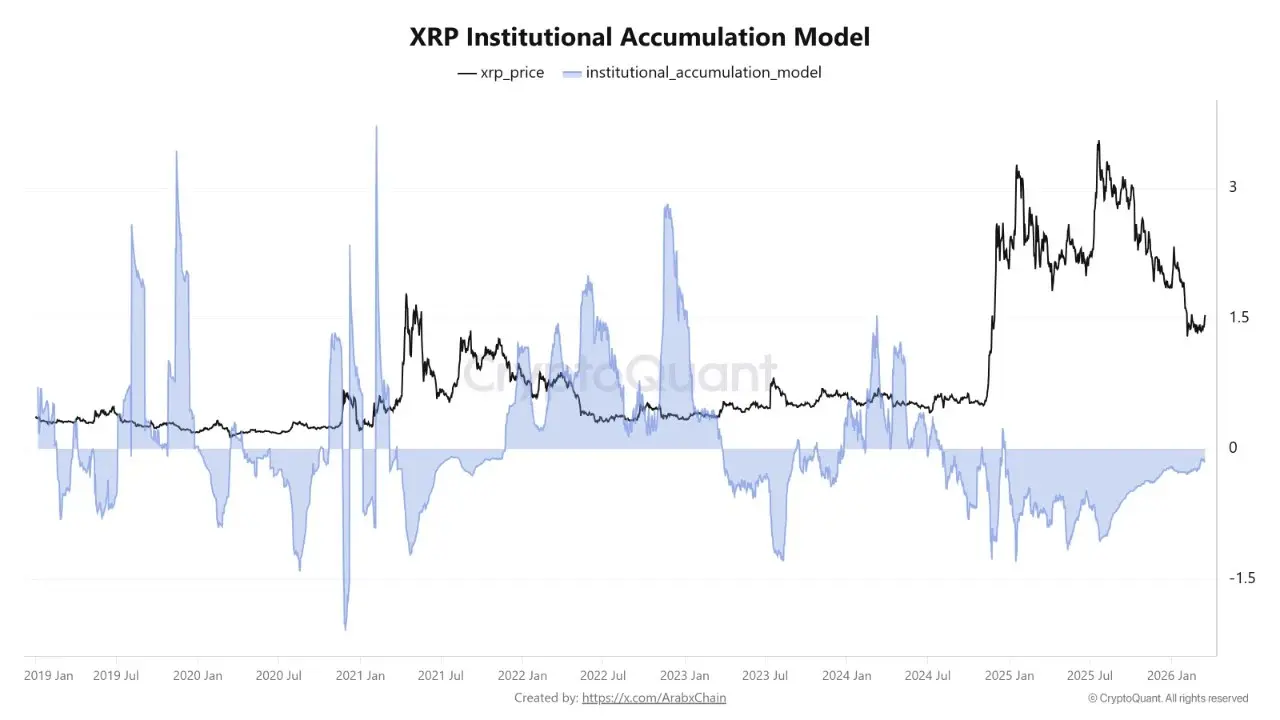 XRP Institutional Accumulation Model | Source: CryptoQuantThat said, the present setup is not entirely bearish. XRP continues to trade at relatively elevated levels despite the lack of strong institutional inflows. This divergence suggests the market may be in a temporary equilibrium, where participants are holding positions rather than aggressively buying or selling. In such environments, price can remain stable, but conviction is typically limited.
From a structural perspective, the persistence of negative readings indicates that new catalysts are likely required to re-engage institutional capital. This could come from macro improvements, regulatory clarity, or renewed demand within the ecosystem. Conversely, a sustained shift of the index back into positive territory would likely act as an early confirmation of accumulation, signaling that smart money is returning and potentially supporting a stronger directional move.
Related Reading: Bitcoin Short-Term Holders Dump 48K BTC In Profit As Price Tests $75K
XRP Struggles Below Key Resistance After Sharp Breakdown
XRP’s 3-day chart reflects a clear structural breakdown followed by a tentative recovery, with price currently stabilizing just below the $1.50 level. The recent decline from the $2.00–$2.20 region confirms a continuation of the broader downtrend, as XRP continues to print lower highs and lower lows since late 2025.
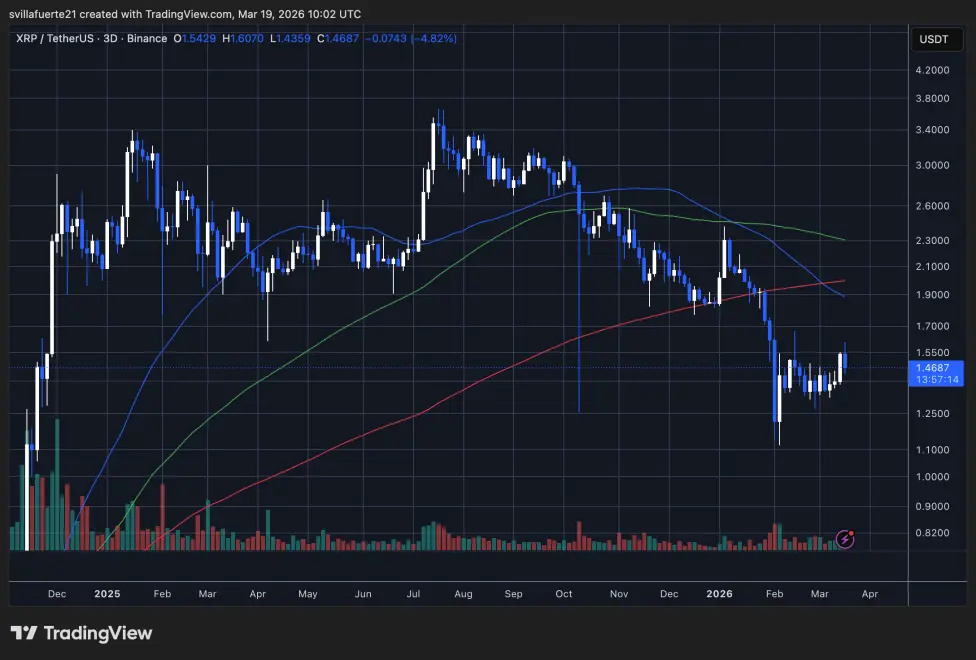 XRP consolidates below the $1.50 level | Source: XRPUSDT chart on TradingView
The most notable feature is the aggressive selloff in early February, where the price briefly capitulated toward the $1.20 region before finding support. This move was accompanied by a spike in volume, suggesting forced selling or liquidation-driven pressure, often seen at local exhaustion points.
XRP consolidates below the $1.50 level | Source: XRPUSDT chart on TradingView
The most notable feature is the aggressive selloff in early February, where the price briefly capitulated toward the $1.20 region before finding support. This move was accompanied by a spike in volume, suggesting forced selling or liquidation-driven pressure, often seen at local exhaustion points.
Related Reading: Ethereum Leverage Climbs After Historic Liquidation Event – New Cycle Starting?
Since then, XRP has entered a consolidation phase between $1.30 and $1.50, attempting to build a base. However, the asset remains below key moving averages, particularly the 200-day moving average, which continues to act as dynamic resistance. The shorter-term averages are also trending downward, reinforcing the lack of bullish confirmation.
Structurally, XRP now faces a critical test. A sustained reclaim of the $1.50–$1.60 zone would be required to shift short-term momentum. Until then, the current price action appears to be a relief bounce within a broader corrective trend, with limited evidence of strong accumulation or trend reversal at this stage.
Featured image from ChatGPT, chart from TradingView.com
![]() Editorial Process for bitcoinist is centered on delivering thoroughly researched, accurate, and unbiased content. We uphold strict sourcing standards, and each page undergoes diligent review by our team of top technology experts and seasoned editors. This process ensures the integrity, relevance, and value of our content for our readers.
Editorial Process for bitcoinist is centered on delivering thoroughly researched, accurate, and unbiased content. We uphold strict sourcing standards, and each page undergoes diligent review by our team of top technology experts and seasoned editors. This process ensures the integrity, relevance, and value of our content for our readers.
Disclaimer: The information on this page may come from third parties and does not represent the views or opinions of Gate. The content displayed on this page is for reference only and does not constitute any financial, investment, or legal advice. Gate does not guarantee the accuracy or completeness of the information and shall not be liable for any losses arising from the use of this information. Virtual asset investments carry high risks and are subject to significant price volatility. You may lose all of your invested principal. Please fully understand the relevant risks and make prudent decisions based on your own financial situation and risk tolerance. For details, please refer to
Disclaimer.
