
Sometimes the market tells you exactly what it’s going to do. You just have to be paying attention. For Canton, the story has been pretty clear for a while now. Down, and then more down.
Sjuul from AltCryptoGems caught this one early. He spotted that bearish rejection just in time, and since then, the CC price has been doing exactly what you’d expect, simply going down.
Read Also: Evernorth’s $1B XRP Play Could Be the Blueprint for Corporate Adoption – Here’s Why
- The CC Chart Tells the Story
- What’s Driving the Downtrend
- Where CC Price Could It Go Next
The CC Chart Tells the Story
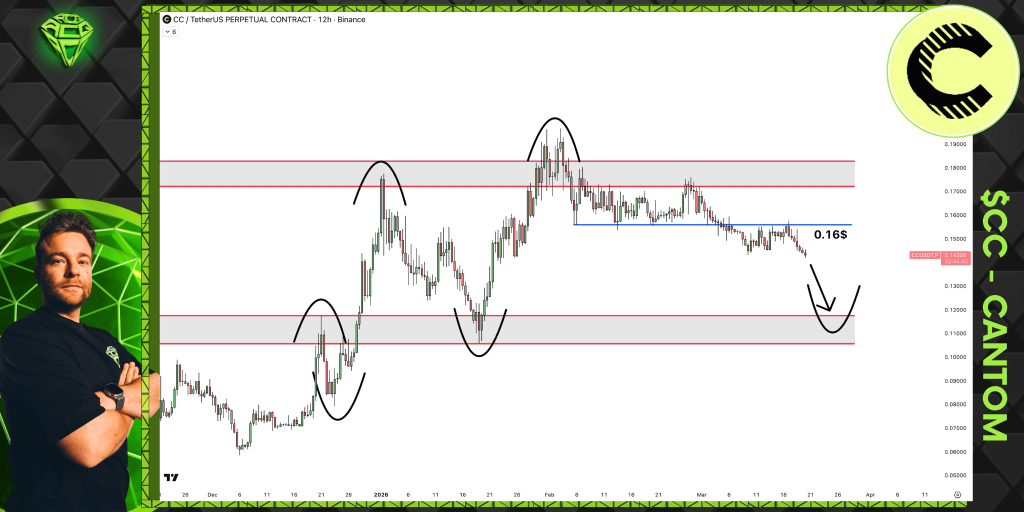
Looking at the 12-hour chart shared by Sjuul, the picture is hard to ignore. The CC price has been in a steady downtrend since late last year, making lower highs and lower lows with almost textbook precision. Every time it tries to bounce, sellers step in and push it back down.
Source: X/@AltCryptoGems
The most recent rejection happened right around that $0.16 zone, which used to act as support but has now flipped into resistance. The chart shows price attempting to reclaim that level, failing, and then sliding lower. That’s the bearish rejection Sjuul was talking about. Once that level gave way, the path of least resistance was clearly down.
Right now, the CC price is trading around $0.12, having sliced through multiple support levels on the way down. The momentum is still bearish, and there’s no sign of a reversal just yet.
Silver Price Just Wiped Out Trillions – Here’s the Proof Banks Are Still in Control_**
What’s Driving the Downtrend
A catalyst is needed sometimes to explain a move. Other times, the chart is the catalyst. For Canton, the structure itself has been telling traders to stay away. When an asset keeps making lower highs and can’t hold support, the smart move is to step aside and let it find a bottom.
Sjuul spotted that rejection early, and that kind of technical awareness is what separates traders who get caught in the chop from those who stay ahead of the move. Once the CC price failed to reclaim $0.16, the next logical move was lower, and that’s exactly what played out.
Gold Price Prediction: 50-Year Pattern Points to $12,000 After a ~46% Correction_**
Where CC Price Could It Go Next
The big question now is where the CC price finds support. The chart shows some previous consolidation around $0.10, which could act as a temporary floor. Below that, the $0.08 to $0.09 zone might attract buyers who remember those levels from earlier in the year.
But until the CC price shows some real strength, like reclaiming $0.13 or putting in a higher low, the trend remains down. That’s just how markets work. You don’t fight the trend, you wait for it to change.
Sjuul’s call on this one was clean. Spot the rejection, respect the structure, and let the trade play out. For Canton, that trade has been one way. Until something changes, it’s hard to see a different outcome.
Disclaimer: The information on this page may come from third parties and does not represent the views or opinions of Gate. The content displayed on this page is for reference only and does not constitute any financial, investment, or legal advice. Gate does not guarantee the accuracy or completeness of the information and shall not be liable for any losses arising from the use of this information. Virtual asset investments carry high risks and are subject to significant price volatility. You may lose all of your invested principal. Please fully understand the relevant risks and make prudent decisions based on your own financial situation and risk tolerance. For details, please refer to
Disclaimer.
