As of writing, Quant (QNT) has gained 4.91% in the past 24 hours and has increased a total of 24.14% over the past week — a notable performance for an mid-cap altcoin, especially when compared to Bitcoin (BTC). The leading cryptocurrency has decreased 2.64% during the same period and has mostly hovered around the $70,000 mark.
In the short to medium term, BTC still has the potential to continue toward the $80,000 zone. This scenario could act as a catalyst for altcoin gains, but only a few projects have shown relative strength early on — and Quant is a notable name.
Although the long-term trend remains bearish, QNT has responded positively at a key demand zone between $55 and $60. In March, this asset surged rapidly from $60.92 to $80.72, a 32.5% increase in just two weeks — indicating significant underlying demand.
Quant Moves Toward High-Value Zones
On the weekly timeframe, QNT maintains a long-term bullish structure, but the internal structure still leans bearish. Notably, even after a strong recovery in March, the local high at $88.3 has not yet been surpassed.
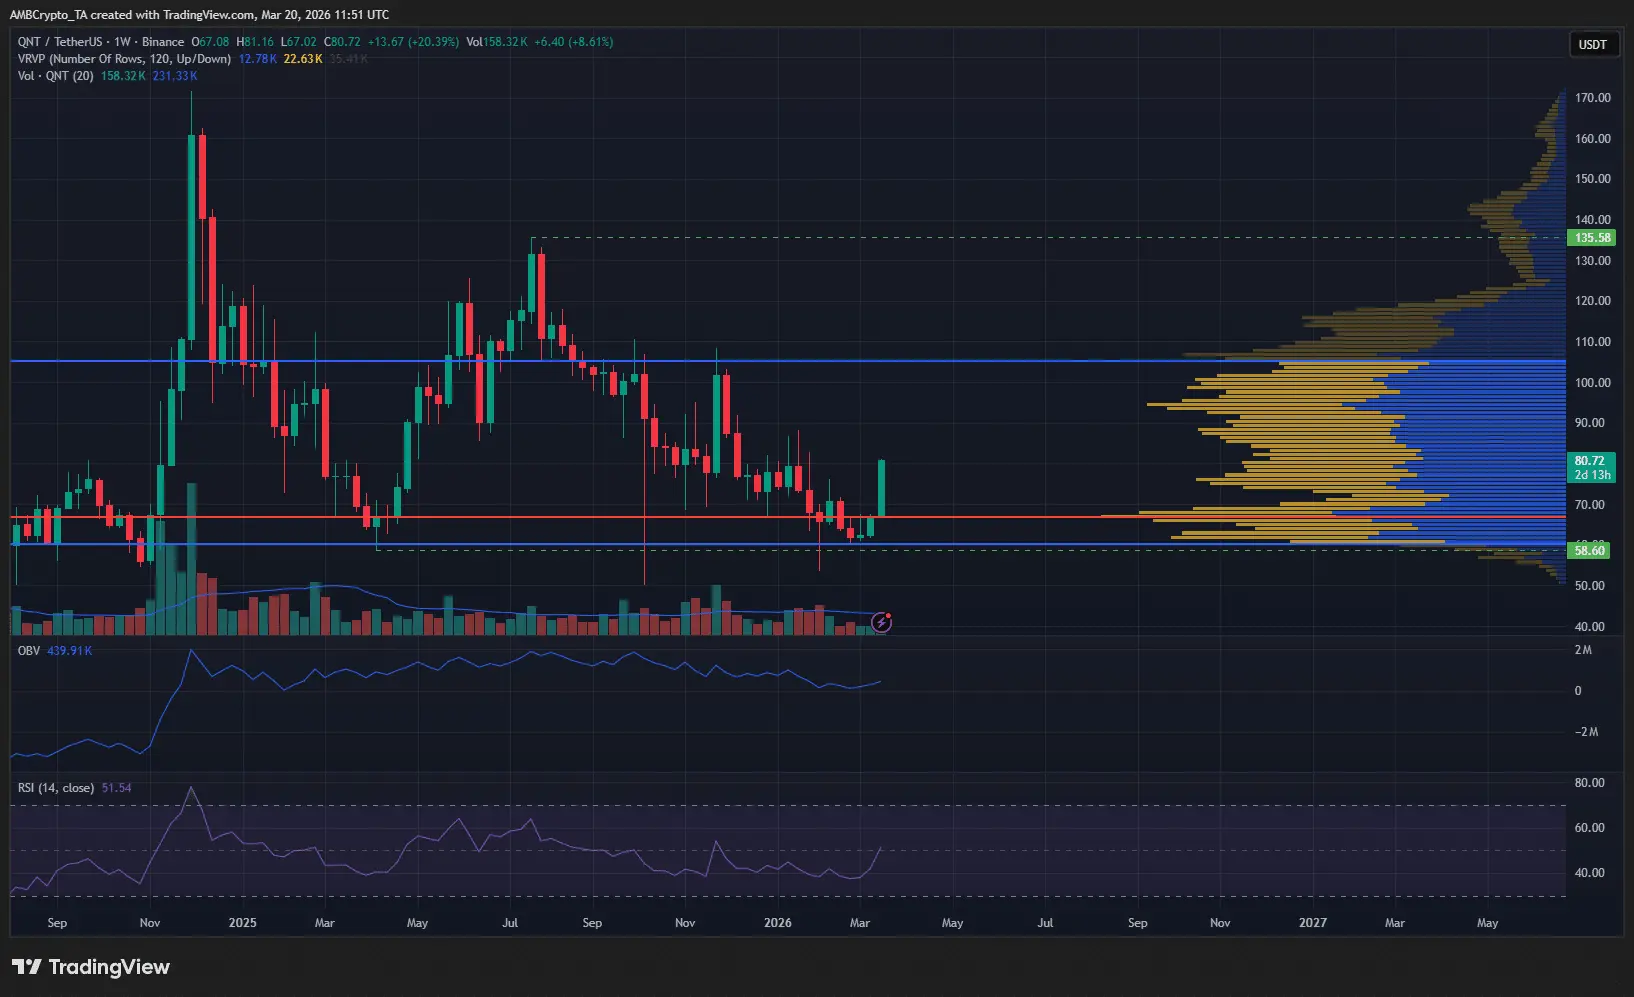 Source: TradingView Visible Range analysis shows the value area between $60 and $105, with the point of control at $67. The shift of high volume nodes toward the buy side is a positive signal, but the market still needs more time to confirm the sustainability of the upward momentum.
Since April 2025, QNT has been confined within a wide range of $58.60–$135.58. Among these, the $88, $105, and $135 levels serve as important resistance points that must be broken to establish a clearer bullish trend.
On the other hand, the OBV indicator has not yet shown a clear improvement, and the RSI remains below the neutral 50 level. These signals suggest that the weekly technical picture is not yet fully tilted in favor of buyers.
QNT Enters a Critical Zone
On the daily chart, the price structure remains bearish. The correction in January and February was used to establish Fibonacci retracement levels, with the $75.04–$80.87 zone identified as the golden area — a sensitive region for supply and demand fluctuations.
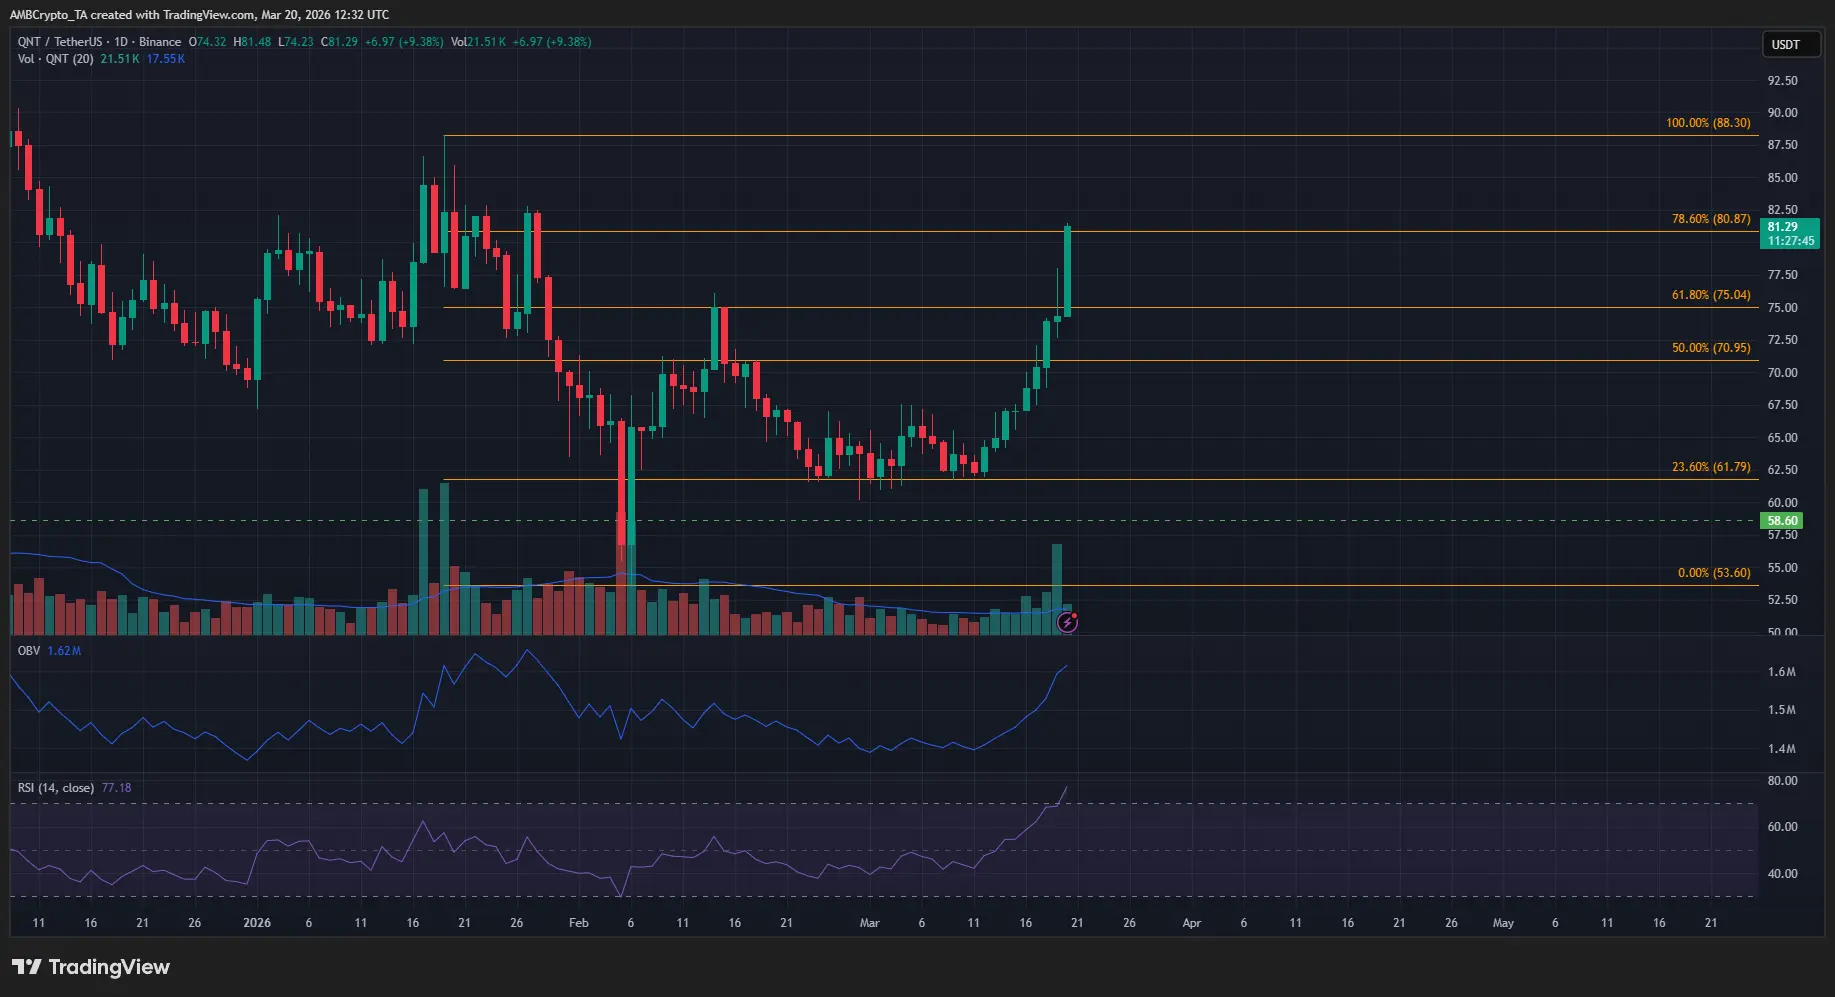 Source: TradingView If sellers regain control, strong pressure is likely to emerge in this price zone. However, so far, this scenario has not been confirmed.
Therefore, short-term traders should wait patiently for clear confirmation signals before opening long positions. Conversely, existing QNT holders might consider taking profits at the current levels. The next trend has not yet been definitively shaped.
A daily close above $88 would strengthen the case for continued upward movement. Conversely, if the price is rejected at $80 and breaks below $75, a bearish reversal is likely.
Disclaimer: The information on this page may come from third parties and does not represent the views or opinions of Gate. The content displayed on this page is for reference only and does not constitute any financial, investment, or legal advice. Gate does not guarantee the accuracy or completeness of the information and shall not be liable for any losses arising from the use of this information. Virtual asset investments carry high risks and are subject to significant price volatility. You may lose all of your invested principal. Please fully understand the relevant risks and make prudent decisions based on your own financial situation and risk tolerance. For details, please refer to
Disclaimer.
