Worldcoin (WLD) experienced an impressive upward movement on March 23rd, as active buyers strongly defended the support zone at $0.3075 (established since February 6th), triggering an 8.46% recovery from the daily low of $0.3039.
However, after reaching $0.3296, the rally quickly weakened. At the time of writing, WLD has retreated to around $0.3175, raising questions about whether this asset has enough momentum to continue its upward trend or if selling pressure will dominate again.
Worldcoin loses the local support level of $0.345
Looking at a longer timeframe, the main trend of Worldcoin remains clearly bearish. Since the crash on October 10th, WLD has lost 73.57% of its value in less than six months.
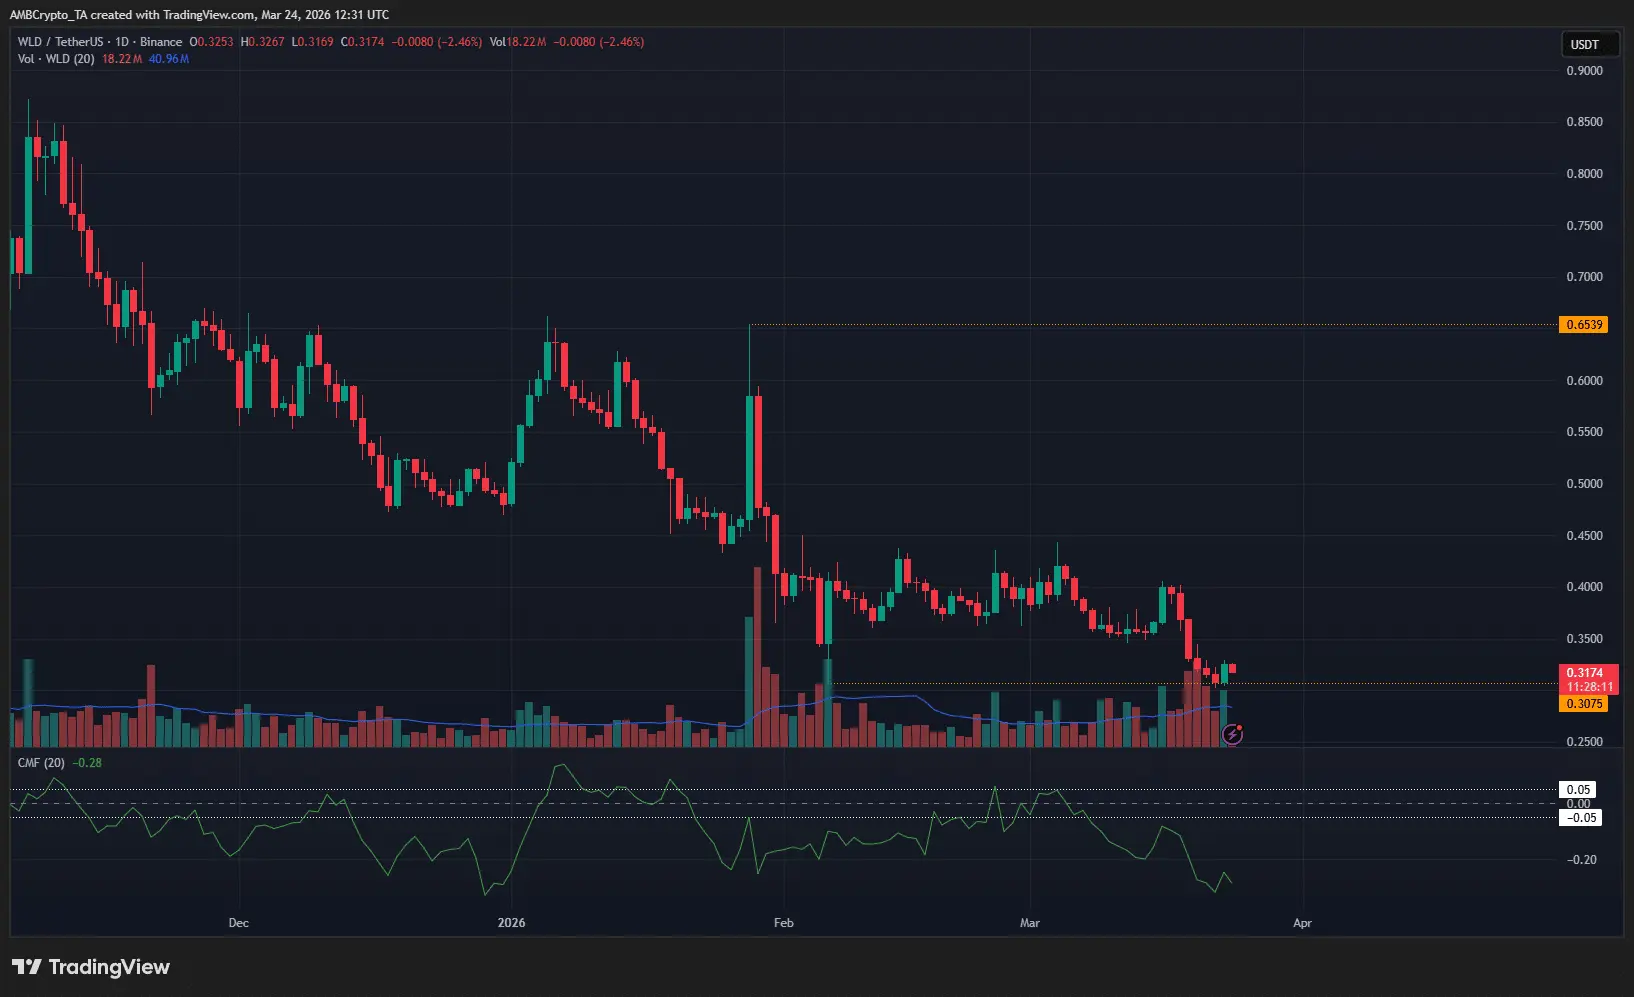 Source: TradingView Although this decline is not unusual in the altcoin market, some assets still show short-term recovery potential in March. Notably, Bitcoin’s return above $70,000 has acted as a catalyst, helping many altcoins improve their short-term price structure.
However, Worldcoin is not among them. On the contrary, WLD continues to set lower lows on the daily chart and has broken below the important support zone of $0.345 formed since February. The decline was only temporarily halted at the bottom of the early February crash.
Trading strategy: Prioritize selling on rebounds
On the 4-hour chart, WLD’s market structure has shifted to bearish since March 19th, when the price broke below the swing low at $0.346. This sharp decline was used to identify Fibonacci retracement levels.
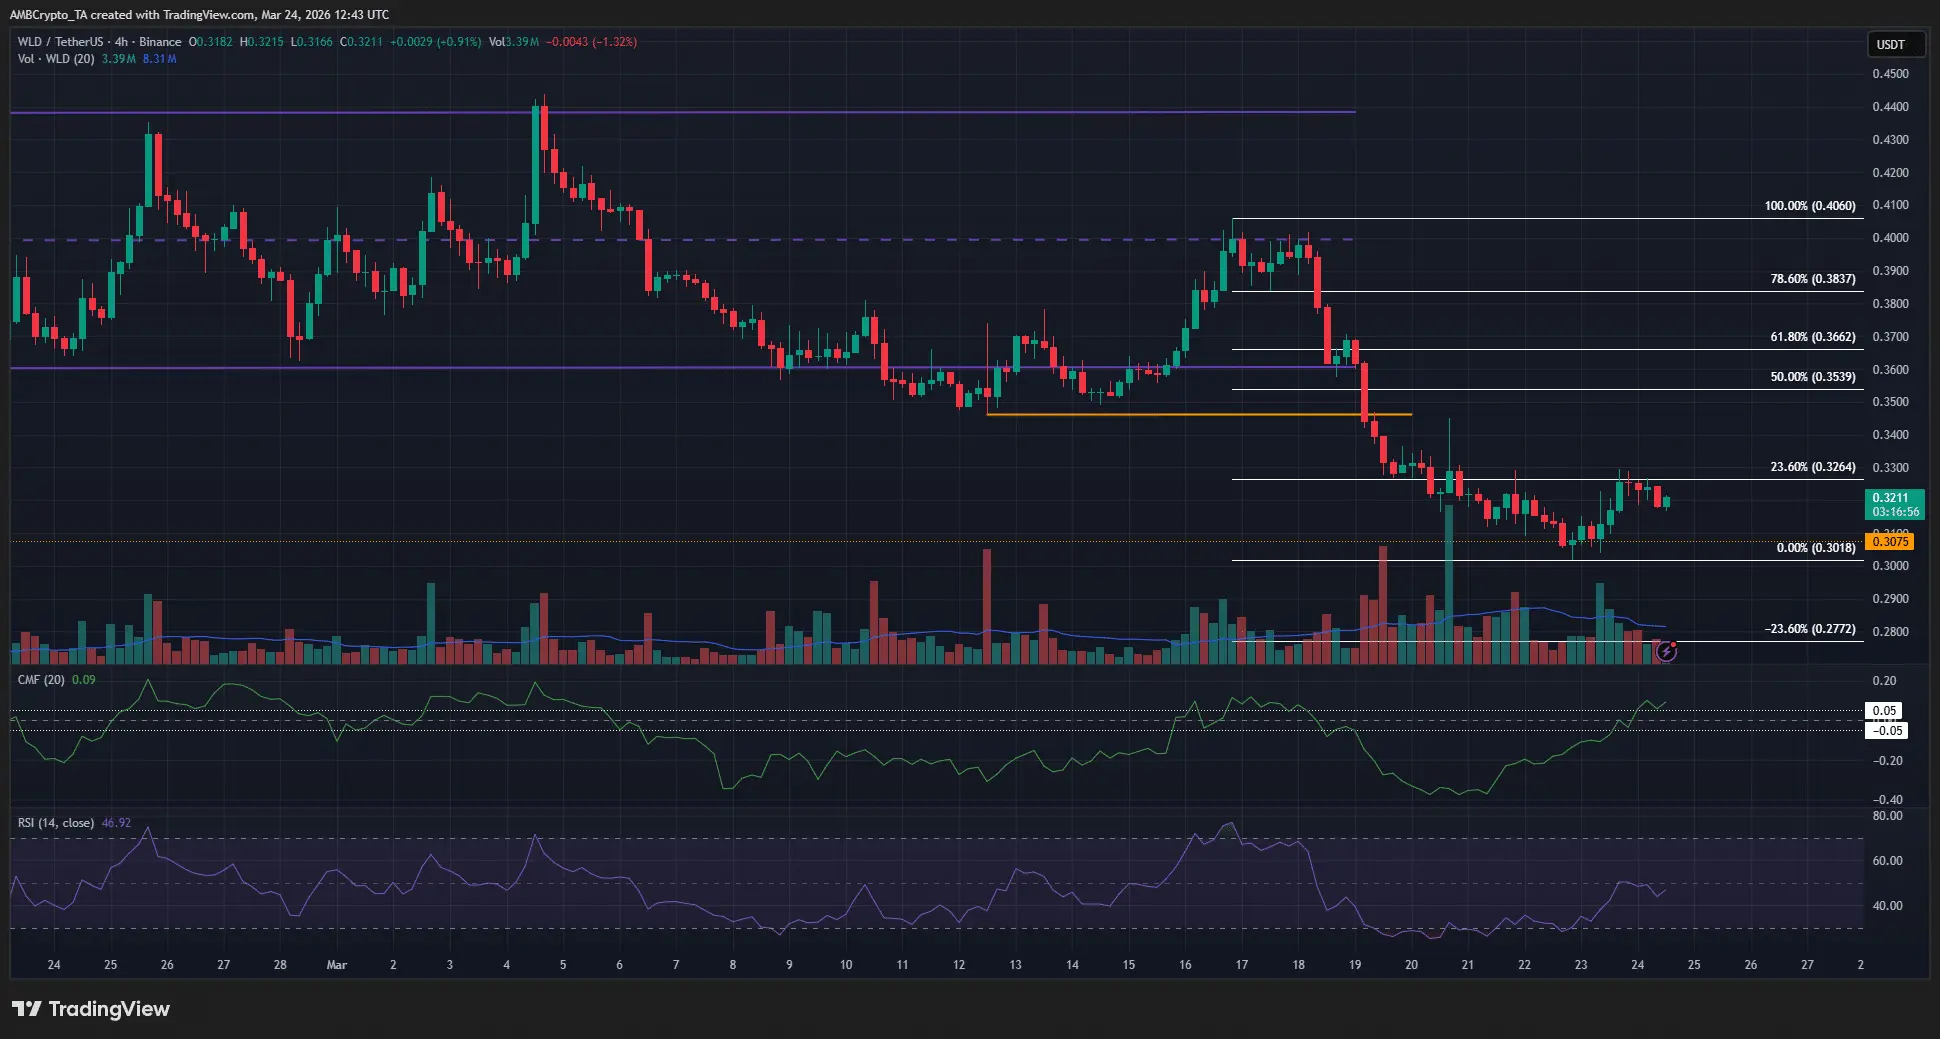 Source: TradingView Currently, the 23.6% Fibonacci level at $0.326 acts as a nearby resistance. If the price continues to be rejected here, WLD could form a technical rebound toward the “golden pocket” between $0.354 and $0.366.
Momentum indicators show neutral to positive signals: RSI hovers around 50, while the CMF has crossed above +0.05, reflecting capital inflows returning to the market. This opens the possibility of short-term recoveries.
However, with the long-term trend still bearish, the strategy remains to capitalize on rebounds to the $0.366 zone to exit positions.
Only a breakout and sustained hold above the local high of $0.406 would truly reverse the market structure into an uptrend, invalidating the current bearish scenario.
Mr. Giáo
Disclaimer: The information on this page may come from third parties and does not represent the views or opinions of Gate. The content displayed on this page is for reference only and does not constitute any financial, investment, or legal advice. Gate does not guarantee the accuracy or completeness of the information and shall not be liable for any losses arising from the use of this information. Virtual asset investments carry high risks and are subject to significant price volatility. You may lose all of your invested principal. Please fully understand the relevant risks and make prudent decisions based on your own financial situation and risk tolerance. For details, please refer to
Disclaimer.
