The current price of Hyperliquid (HYPE) is trading around $38.27, down 2.31% for the day, amidst the completion of a double top pattern and a dense liquidation cluster at $35.03 significantly increasing the risk of a strong downward correction.
After failing to maintain upward momentum above $42.67, HYPE has entered an accumulation phase. At this point, the short-term trend is being shaped by two independent but converging technical signals.
Increased Risk for Long Positions
Liquidation heatmap data shows a densely concentrated area of long positions using leverage around $35.03, with a total value of up to $27.36 million.
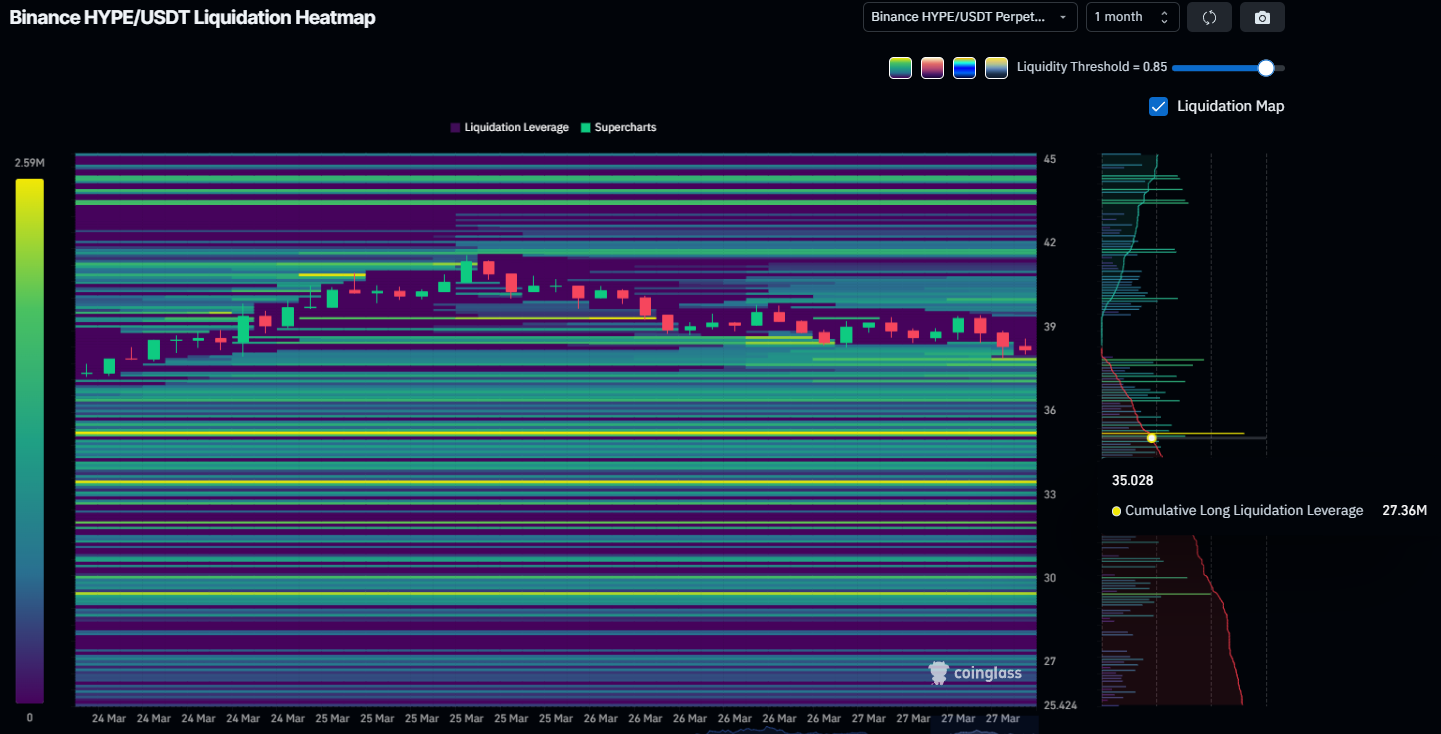 HYPE Liquidation Heatmap | Source: Coinglass If this level is breached, a wave of forced liquidations could occur in a chain reaction shortly, creating mechanical selling pressure and amplifying the decline beyond the initial breakout level.
Notably, the area from $38 to $35 has a relatively thin density of liquidations, implying that the price could slide quickly through this zone with limited resistance. At the same time, the lack of significant long leverage clusters above $39 also weakens the potential for a short-term reversal based on demand.
Selling Pressure Dominates
The Klinger Oscillator (KVO) on the daily chart currently registers at 8.09K, remaining above the 0 line but showing a marked decline. The signal line has turned downward, while the KVO line approaches a bearish crossover — a sign that momentum is weakening.
Essentially, KVO measures the difference between two volume-weighted EMA lines to determine the inflow/outflow of money into the asset. When the indicator is above the 0 threshold, buying pressure dominates; conversely, when it falls below 0, the market shifts to a selling pressure state.
KVO peaked near 25K in early March, coinciding with HYPE’s rise to $43.76. Since then, the indicator has continuously formed lower peaks — a typical weakening structure of buying momentum, closely reflecting price action.
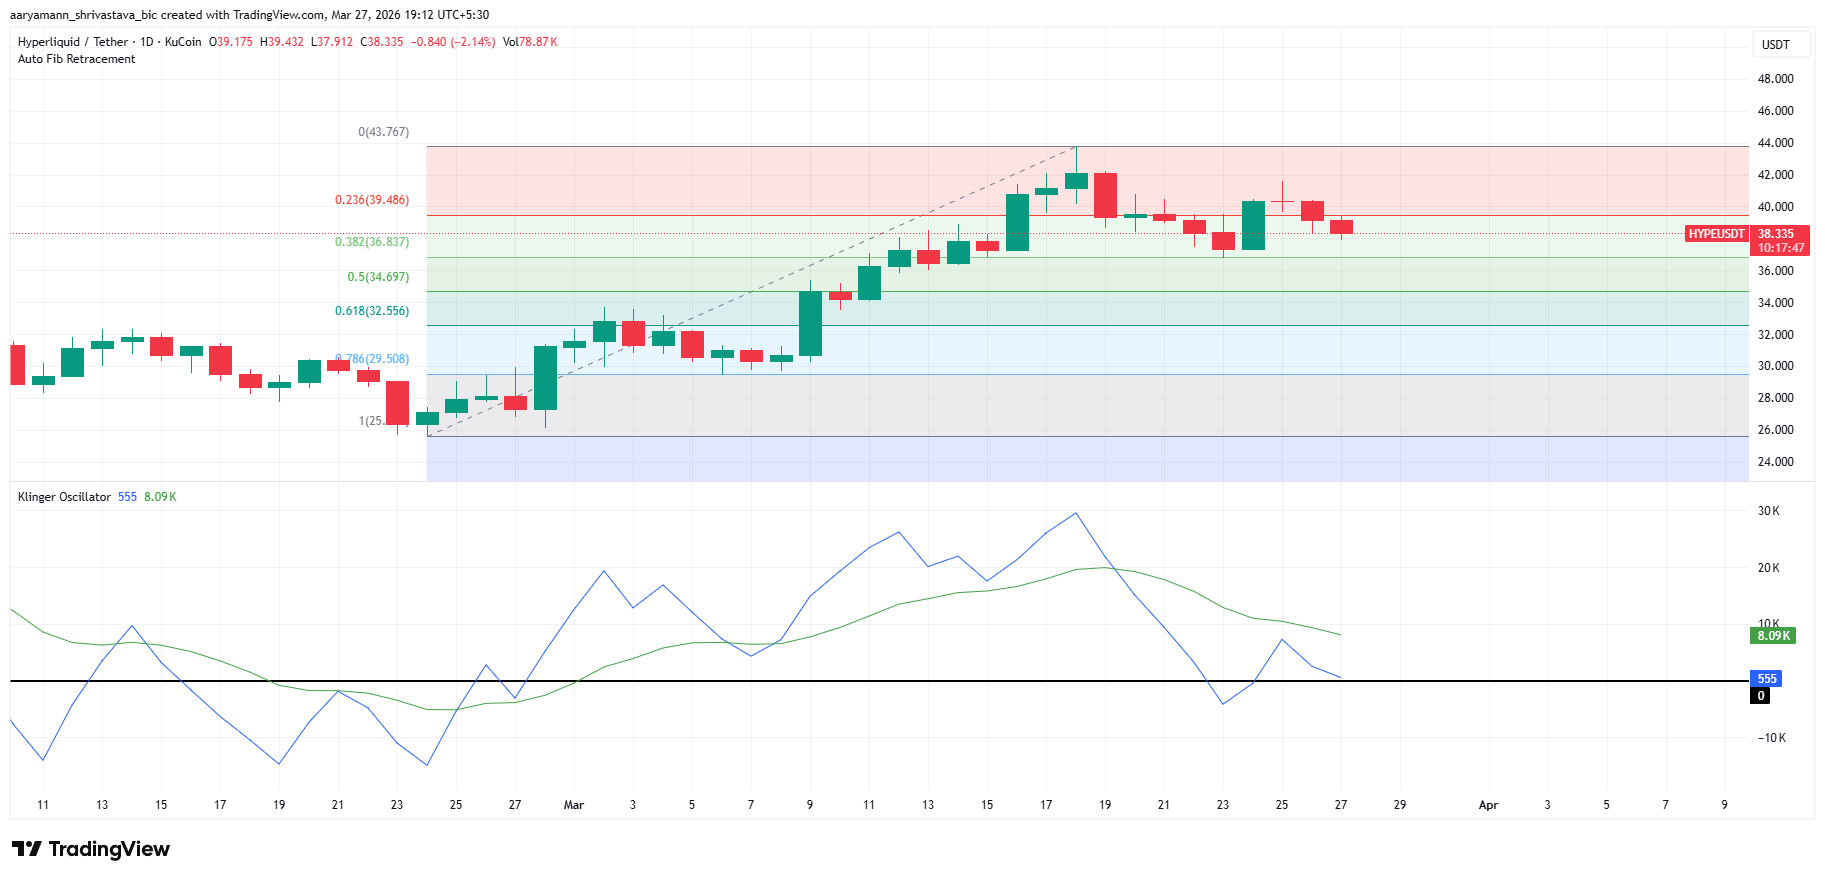 HYPE KVO Indicator | Source: TradingView If KVO confirms a drop below the 0 threshold, volume momentum will officially shift to a bearish state. In HYPE’s historical trading on the daily chart, breaches of this threshold often precede significant corrections.
The Fibonacci retracement level of 0.382 at $36.83 currently acts as the first critical demand zone before the price approaches the liquidation cluster at $35.03. In a negative scenario, if KVO drops below 0 while the price slides below $36.83, the target of $32.33 (the Fibonacci 0.618 level) will become the base case scenario.
Important Price Levels to Watch
The daily chart confirms that HYPE has completed the double top structure and is in the process of breaking down. The price currently hovers around $38.27, just above the short-term support area.
The downside target of the pattern is calculated from the neckline at $35.03, indicating the possibility of the price retreating to $21.64 if a complete breakout is confirmed — corresponding to a correction of about 37.49%.
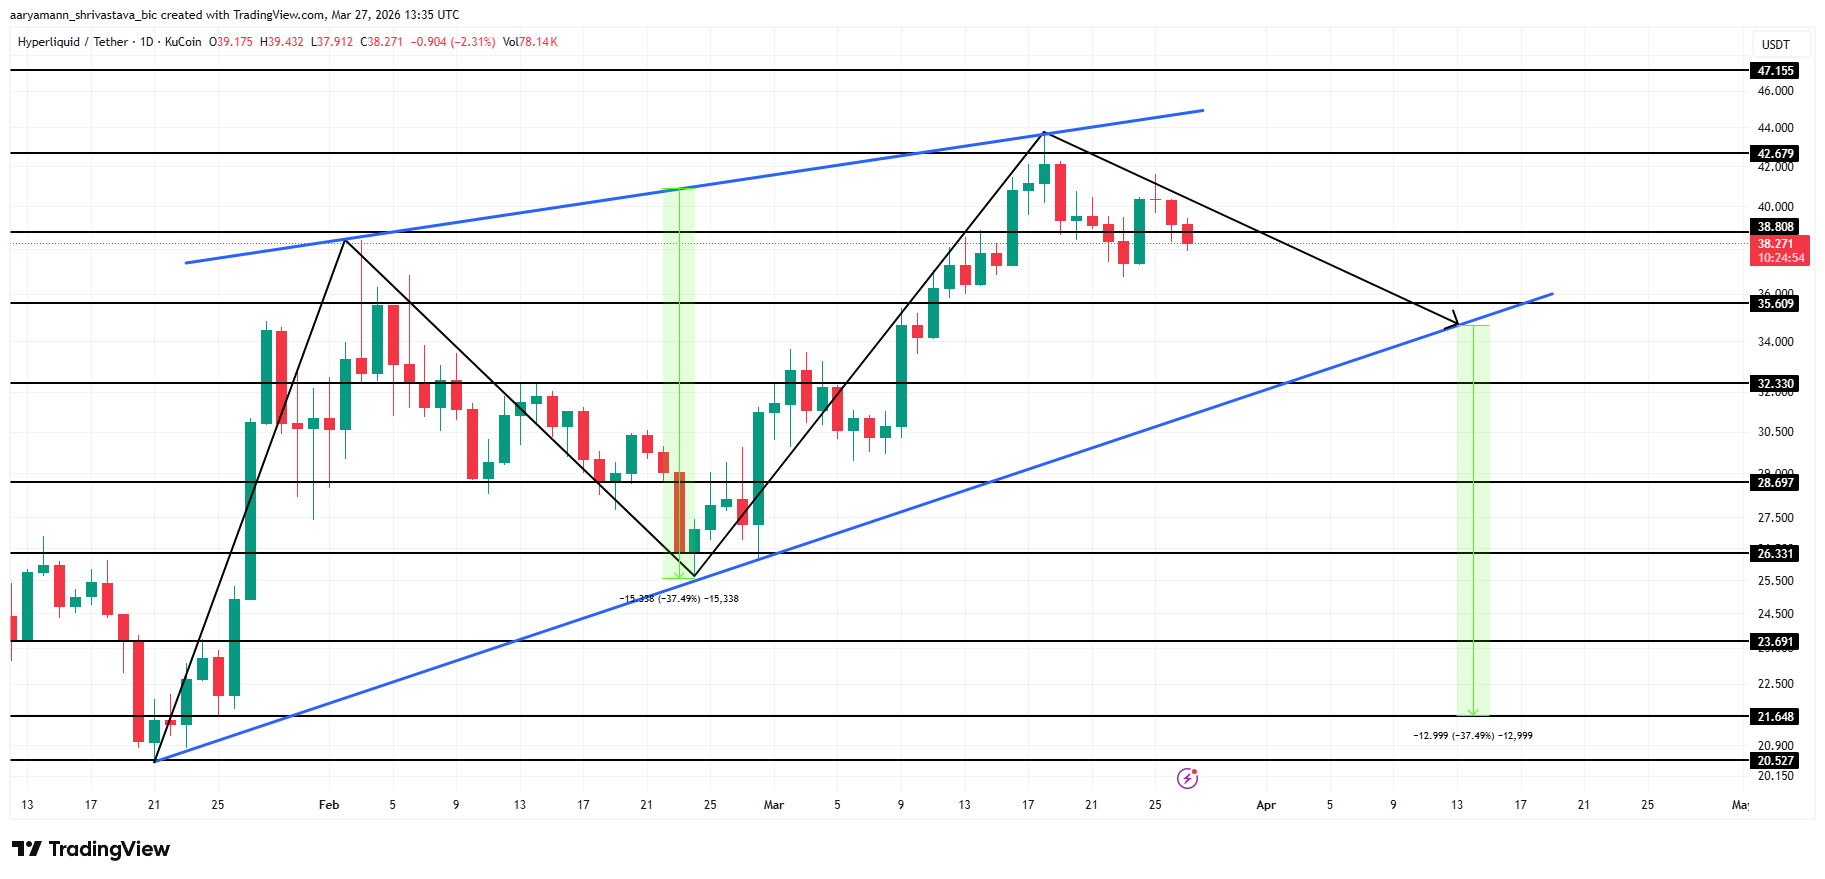 HYPE Price Analysis | Source: TradingView Thus, the $35.03 level is crucial for buyers. A daily candle close below this level will confirm the double top structure, opening the downside potential to $32.33, followed by $28.69.
On the flip side, the bearish scenario will only be invalidated if HYPE reclaims the $38.80 level and maintains sufficient momentum to break through $42.67. Once this resistance area is conquered, the double top structure will be negated, thereby reinstating an upward trend with the next target at $47.15.
Disclaimer: The information on this page may come from third parties and does not represent the views or opinions of Gate. The content displayed on this page is for reference only and does not constitute any financial, investment, or legal advice. Gate does not guarantee the accuracy or completeness of the information and shall not be liable for any losses arising from the use of this information. Virtual asset investments carry high risks and are subject to significant price volatility. You may lose all of your invested principal. Please fully understand the relevant risks and make prudent decisions based on your own financial situation and risk tolerance. For details, please refer to
Disclaimer.
