Cardano (ADA) continues to plummet and approaches the key support level of $0.40 at the time of writing on Friday. Notably, the sell-off occurred even as the US Federal Reserve (Fed) announced a monetary policy easing decision, amid market uncertainty about the 2026 interest rate cut trajectory.
Although the Fed cut the benchmark lending rate by 25 basis points to 3.50%–3.75% early Thursday morning, the overall outlook remains hawkish. Chairman Jerome Powell warned that persistent inflation pressures along with a cooling labor market could lead the Fed to implement fewer rate cuts than previously expected.
In this context, Cardano along with other risky assets likely remains under bearish pressure until the market stabilizes and new strong catalysts emerge to reverse the trend.
Retail investor interest in Cardano declines
The Cardano derivatives market has yet to recover from the shock sell-off on 10/10, when nearly $118 million in long positions and $22 million in short positions were wiped out. In just one day, the cryptocurrency market lost around $19 billion, severely weakening investor sentiment.
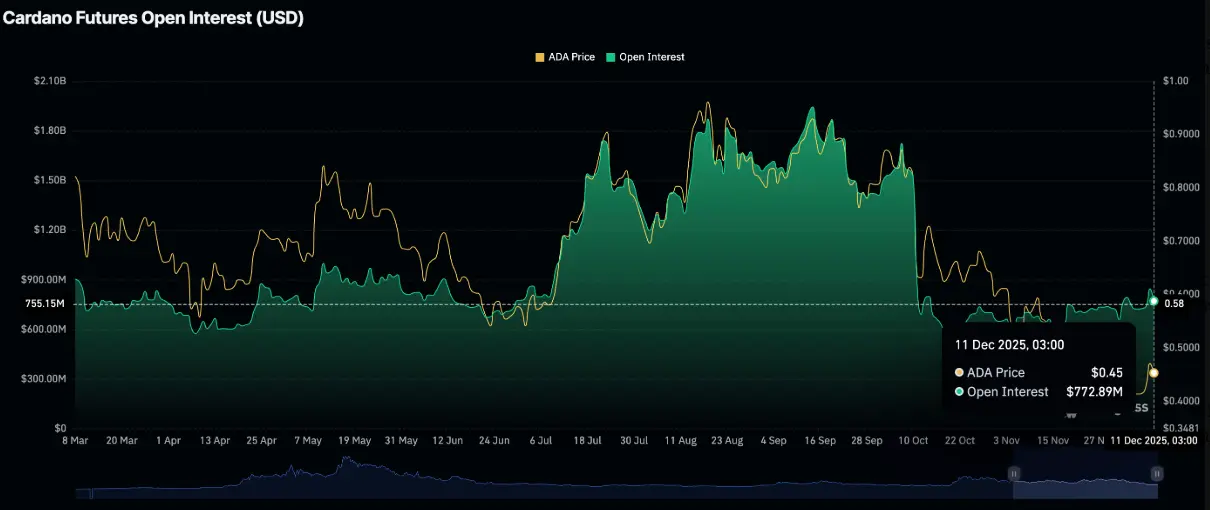
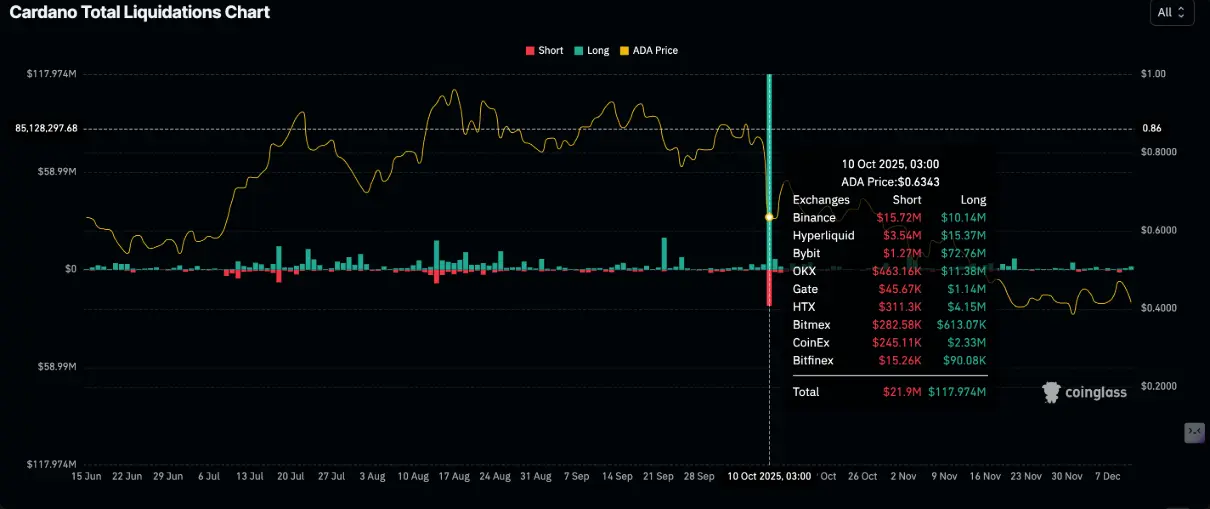 Cardano liquidation data | Source: CoinGlassSince that leverage reduction, retail investor demand for Cardano has remained subdued. Open interest (OI) in futures contracts dropped to an average of $773 million on Thursday, down from $847 million the day before. Previously, OI reached $1.51 billion on 10/10 and peaked at $1.95 billion on 9/14.
To improve market sentiment and attract retail capital back, OI needs to recover steadily to establish a firm foundation for a bullish trend.
 Open contract volume of Cardano | Source: CoinGlass## Technical outlook: Bears tighten control
Cardano (ADA) is currently trading around $0.41, down more than 15% from its local peak at $0.48. Strong selling pressure keeps this cryptocurrency below key EMA levels: EMA 50 at (0.434 USD), EMA 100 at (0.437 USD), and EMA 200 at (0.47 USD) on the 4-hour chart. Notably, the EMA 50 is crossing below the EMA 100, further confirming the short-term downtrend.
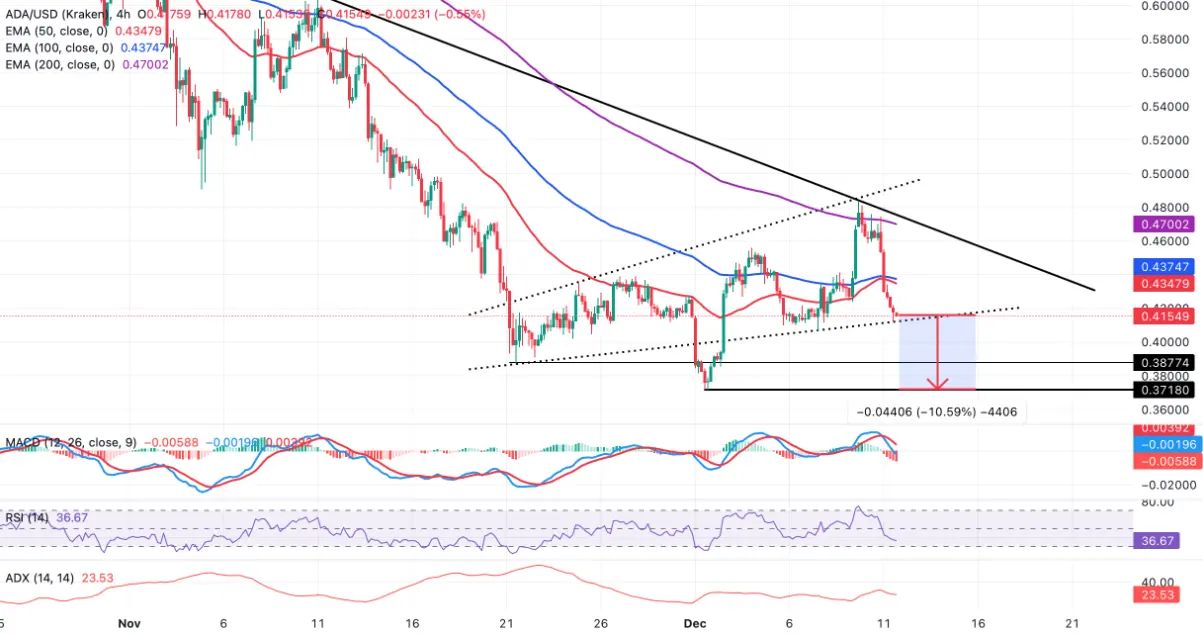 ADA/USDT 4-hour chart | Source: TradingViewThe MACD line has crossed below the signal line and expanded into negative territory, indicating accelerating bearish momentum. Meanwhile, RSI has fallen to 37, suggesting selling pressure dominates but is not yet oversold. The inability of this indicator to stay above the neutral level continues to favor the bears. On the price chart, a downward trendline from around $0.60 is blocking any recovery efforts, with the $0.47 zone serving as a key resistance.
The downward trend strength of ADA is moderate, as reflected by the ADX indicator oscillating around 24 after cooling from previous peaks. If the bulls can push the price back above the EMA 50 and EMA 100 at around $0.43, the recovery momentum could extend toward the EMA 200 near $0.47. Conversely, continued failure at this resistance zone would keep the downtrend in control, pushing ADA back to test the December low at $0.37.
Disclaimer: The information on this page may come from third parties and does not represent the views or opinions of Gate. The content displayed on this page is for reference only and does not constitute any financial, investment, or legal advice. Gate does not guarantee the accuracy or completeness of the information and shall not be liable for any losses arising from the use of this information. Virtual asset investments carry high risks and are subject to significant price volatility. You may lose all of your invested principal. Please fully understand the relevant risks and make prudent decisions based on your own financial situation and risk tolerance. For details, please refer to
Disclaimer.
Related Articles
BNB Chain leads the AI sector with 39.9% market share, so why is the price still falling?
BNB Chain is emerging as a leader in the AI agent ecosystem, holding 39.9% market share. However, its token BNB's price has not reflected this growth, remaining 25.9% below its previous peak, as market sentiment remains cautious.
TapChiBitcoin14m ago
The Number of XRP Wallets Just Broke Another Record – Here’s What the Distribution Looks Like
XRP just crossed a milestone that doesn’t show up on the price charts. The number of wallets holding less than 100 XRP hit an all‑time high, pushing total addresses on the ledger to new levels.
Even though traders stare at the $1.45 price level and wonder where the next move comes from, the ne
CaptainAltcoin16m ago
Bitcoin Holds Strong at $70,000! On-Chain Data Reveals "Collective Selling Wave," Retail Investors Emerge as Biggest Selling Pressure
Under Middle East geopolitical tensions, Bitcoin faced widespread selling pressure, particularly from retail holders. According to Glassnode data, the market is experiencing heavy selling pressure, with the accumulated trend score declining to 0.04, indicating that retail and small-to-medium investors are reducing their positions significantly. Despite this, Bitcoin's resilience against the decline has surprised market observers.
区块客1h ago
Dogecoin Slides Despite Elon Musk Reviving DogeFather Persona
Key Insights
Elon Musk’s DogeFather post sparked attention, yet Dogecoin’s price declined, showing limited market reaction despite strong social media engagement and renewed community discussion.
Dogecoin traded near $0.093 after a failed recovery attempt, with steady volume and moderate
CryptoFrontNews1h ago
Bittensor Holds Strength but Faces Resistance Near $285 Level
Key Insights:
Bittensor maintains strong short-term momentum above key averages, while ETF developments and high staking levels continue shaping liquidity and investor demand dynamics.
Overbought technical indicators signal stretched conditions, even as bullish momentum persists,
CryptoFrontNews2h ago
Hyperliquid Price Jumps 22% as Commodity Trading Hits Record
Key Insights:
Hyperliquid surged over 20% weekly, driven by record commodity futures trading volumes, especially oil and silver contracts, gaining strong traction among traders.
Whale activity surpassed $3.6 billion in leveraged positions, boosting liquidity and reinforcing upward momentum a
CryptoFrontNews2h ago
