Cardano (ADA) continues to plummet and approaches the key support level of $0.40 at the time of writing on Friday. Notably, the sell-off occurred even as the US Federal Reserve (Fed) announced a monetary policy easing decision, amid market uncertainty about the 2026 interest rate cut trajectory.
Although the Fed cut the benchmark lending rate by 25 basis points to 3.50%–3.75% early Thursday morning, the overall outlook remains hawkish. Chairman Jerome Powell warned that persistent inflation pressures along with a cooling labor market could lead the Fed to implement fewer rate cuts than previously expected.
In this context, Cardano along with other risky assets likely remains under bearish pressure until the market stabilizes and new strong catalysts emerge to reverse the trend.
Retail investor interest in Cardano declines
The Cardano derivatives market has yet to recover from the shock sell-off on 10/10, when nearly $118 million in long positions and $22 million in short positions were wiped out. In just one day, the cryptocurrency market lost around $19 billion, severely weakening investor sentiment.
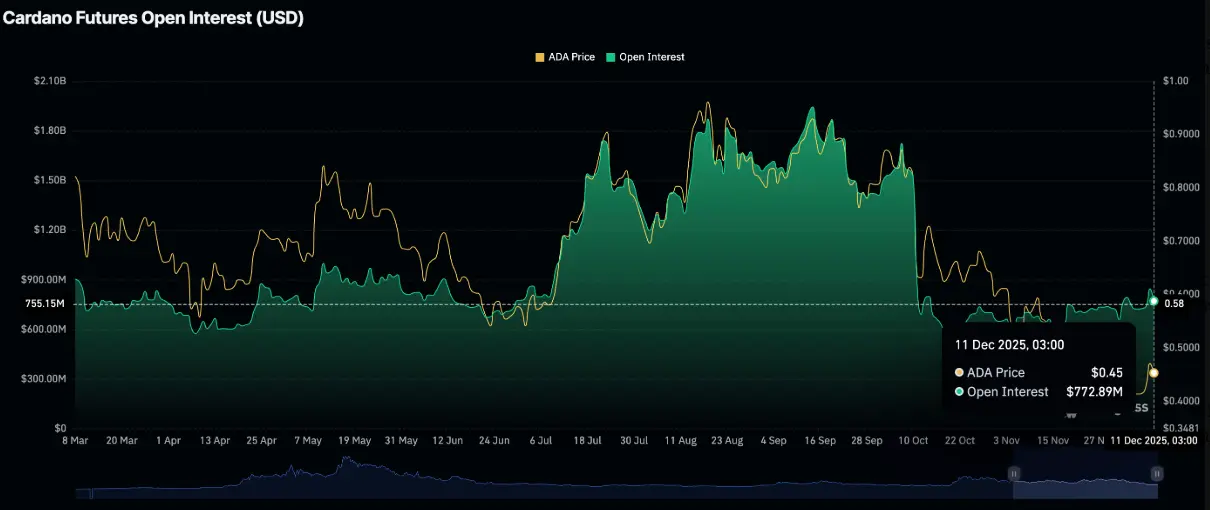
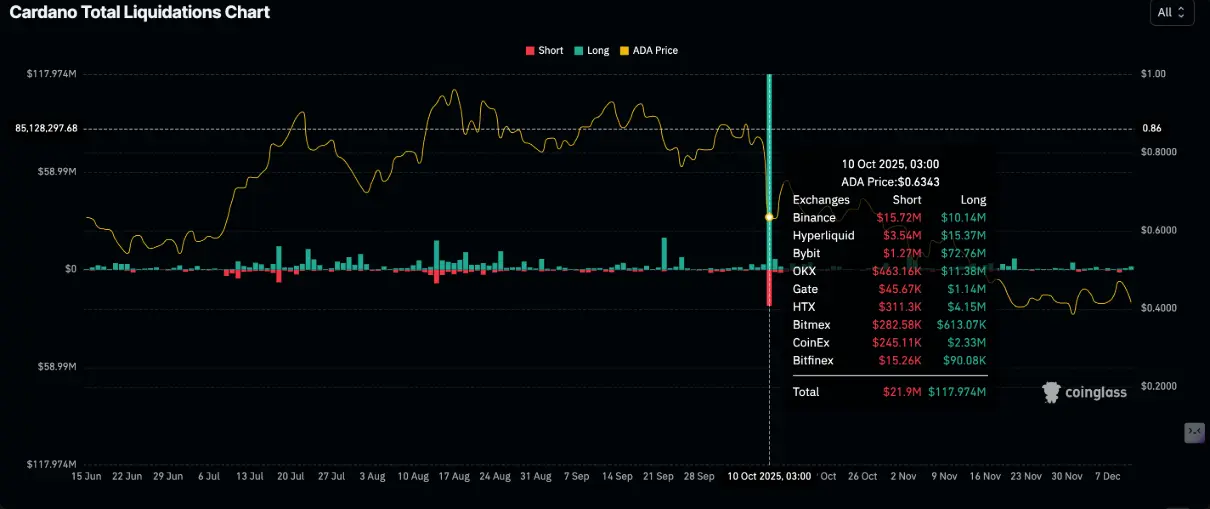 Cardano liquidation data | Source: CoinGlassSince that leverage reduction, retail investor demand for Cardano has remained subdued. Open interest (OI) in futures contracts dropped to an average of $773 million on Thursday, down from $847 million the day before. Previously, OI reached $1.51 billion on 10/10 and peaked at $1.95 billion on 9/14.
To improve market sentiment and attract retail capital back, OI needs to recover steadily to establish a firm foundation for a bullish trend.
 Open contract volume of Cardano | Source: CoinGlass## Technical outlook: Bears tighten control
Cardano (ADA) is currently trading around $0.41, down more than 15% from its local peak at $0.48. Strong selling pressure keeps this cryptocurrency below key EMA levels: EMA 50 at (0.434 USD), EMA 100 at (0.437 USD), and EMA 200 at (0.47 USD) on the 4-hour chart. Notably, the EMA 50 is crossing below the EMA 100, further confirming the short-term downtrend.
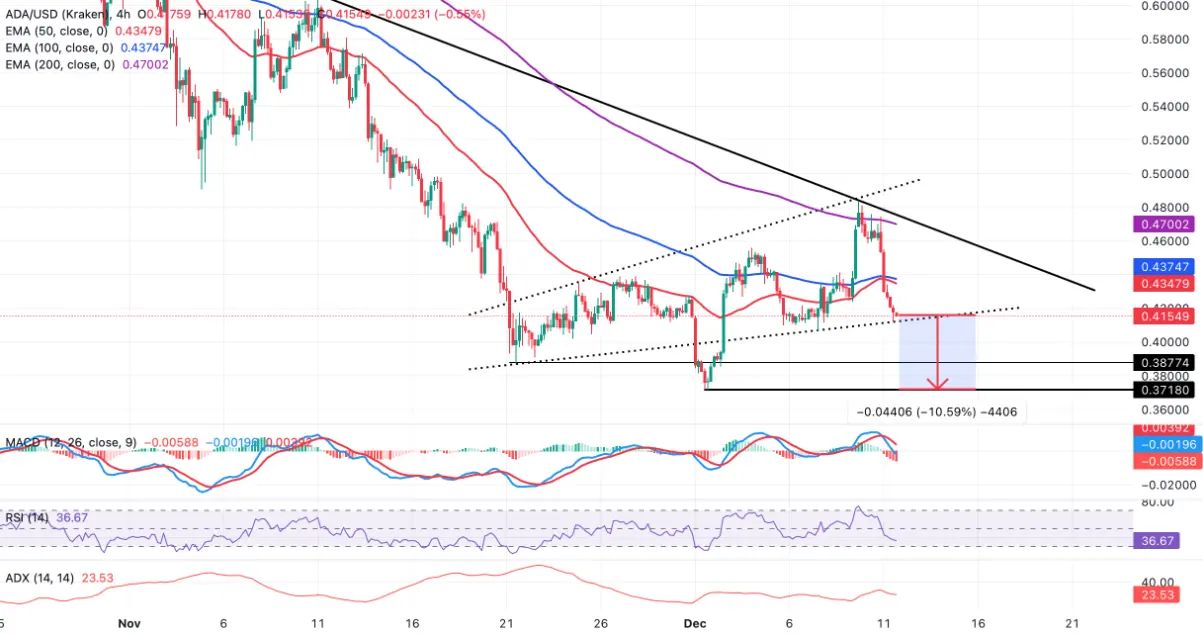 ADA/USDT 4-hour chart | Source: TradingViewThe MACD line has crossed below the signal line and expanded into negative territory, indicating accelerating bearish momentum. Meanwhile, RSI has fallen to 37, suggesting selling pressure dominates but is not yet oversold. The inability of this indicator to stay above the neutral level continues to favor the bears. On the price chart, a downward trendline from around $0.60 is blocking any recovery efforts, with the $0.47 zone serving as a key resistance.
The downward trend strength of ADA is moderate, as reflected by the ADX indicator oscillating around 24 after cooling from previous peaks. If the bulls can push the price back above the EMA 50 and EMA 100 at around $0.43, the recovery momentum could extend toward the EMA 200 near $0.47. Conversely, continued failure at this resistance zone would keep the downtrend in control, pushing ADA back to test the December low at $0.37.
Disclaimer: The information on this page may come from third parties and does not represent the views or opinions of Gate. The content displayed on this page is for reference only and does not constitute any financial, investment, or legal advice. Gate does not guarantee the accuracy or completeness of the information and shall not be liable for any losses arising from the use of this information. Virtual asset investments carry high risks and are subject to significant price volatility. You may lose all of your invested principal. Please fully understand the relevant risks and make prudent decisions based on your own financial situation and risk tolerance. For details, please refer to
Disclaimer.
Related Articles
Where Could Kaspa (KAS) Price Go This Week?
Kaspa (KAS) is showing serious resilience even as its price remains near lows. Kaspa’s hash rate is holding near all-time highs, showing miners aren’t stepping back and the network’s backbone is rock solid.
A major hardfork is coming on May 5, bringing native tokens and more programmability.
CaptainAltcoin17m ago
19.81% Surge for DUSK: What It Means for Traders
DUSK's price surged 19.81% to $0.09667 amid increased market activity and a broader altcoin shift. Analysts highlight its rising relevance and key resistance at $0.10, suggesting significant future trading interest.
Coinfomania32m ago
Bitcoin Briefly Falls Below $70,000 Mark During Asian Session as Fed Hawkishness and Macro Uncertainty Weigh on Market Volatility
Bitcoin dipped below $70,000 on March 19th, touching a low of approximately $69,537, reflecting the market's reassessment of the Federal Reserve's interest rate decision and inflation outlook. Although it later rebounded to around $70,180, the $70,000 level remains a key support in the near term. With weakening market sentiment, coupled with energy prices and macro risks, capital is turning more conservative, and Bitcoin may consolidate around the $70,000 level going forward.
区块客1h ago
XRP Enjoying 'Strong Retail Demand,' Report Says - U.Today
The essay explores the contrasting dynamics between retail and institutional demand in the cryptocurrency market. It highlights XRP's strong retail base and growing adoption, while institutional interest remains cautious, especially compared to assets like Bitcoin and Ethereum, amid recent ETF flows.
UToday1h ago
Fractal model predicts Bitcoin will hit bottom in October 2026
Bitcoin shows positive recovery signals, improving market sentiment after a long phase of volatility. However, experts believe the current uptrend is short-term, with deeper correction risks ahead. According to Crypto Rover's fractal model, Bitcoin's price follows a four-year cycle influenced by halving events. The current cycle likely peaked in late 2025, with further declines expected before a potential bottom around 2026. Short-term price fluctuations can mislead investors, emphasizing the importance of understanding these cycles for long-term trends.
TapChiBitcoin2h ago
Bittensor Holds Strength but Faces Resistance Near $285 Level
Key Insights:
Bittensor maintains strong short-term momentum above key averages, while ETF developments and high staking levels continue shaping liquidity and investor demand dynamics.
Overbought technical indicators signal stretched conditions, even as bullish momentum persists,
CryptoFrontNews2h ago
