Date: Sat, Dec 27, 2025 | 10:25 AM GMT
Dash (DASH), the privacy-focused token, has struggled alongside the broader altcoin market over the past month, shedding nearly 35% of its value amid persistent selling pressure. However, price action is now starting to stabilize, with DASH trading in the green today and posting a modest 4% recovery. More importantly, the latest chart structure suggests that the recent rebound may not be just a short-lived bounce, but part of a developing bullish setup.
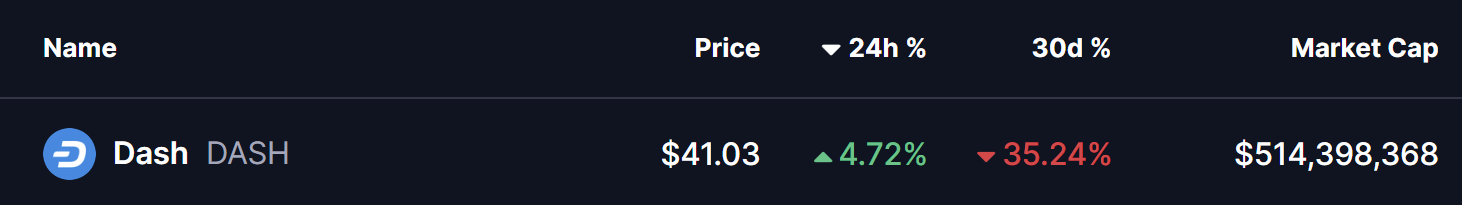
Source: Coinmarketcap
Harmonic Pattern Hints at Potential Upside
On the 4-hour timeframe, DASH is forming a Bearish Butterfly harmonic pattern. While the name may sound negative, this pattern typically allows for a strong upside move during its CD leg before price reaches the final reversal zone.
The structure began at Point X near $42.64, followed by a sharp decline into Point A. From there, DASH rebounded toward Point B, where sellers briefly reasserted control, before price dipped once again into Point C around $36.17. This region has since acted as a firm base, with buyers stepping in aggressively to defend the lows.
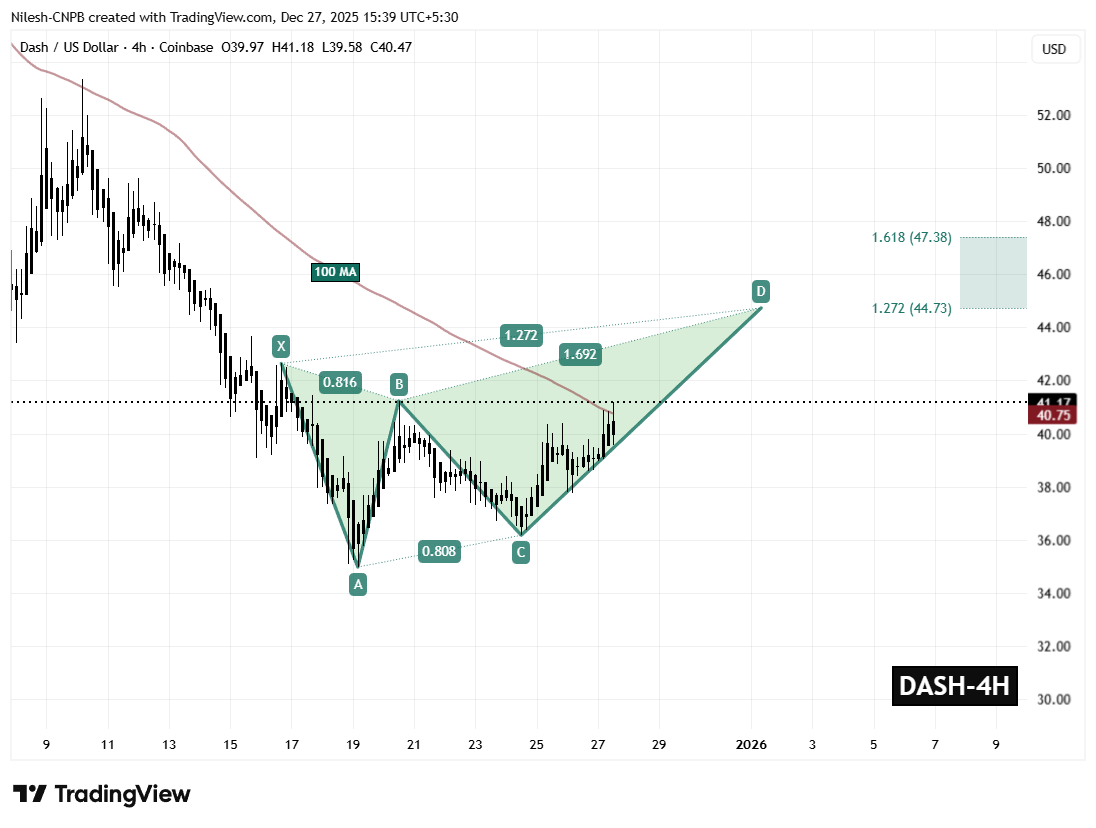
Dash (DASH) 4H Chart/Coinsprobe (Source: Tradingview)
From Point C, DASH has staged a steady recovery and is currently trading near $41.17. This move indicates improving momentum and suggests that the CD leg of the harmonic structure is actively unfolding.
Adding further strength to this setup is DASH’s successful reclaim of the 100-period moving average near $40.75. This level had previously acted as dynamic resistance throughout the downtrend, and flipping it into support marks a meaningful shift in short-term market structure.
What’s Next for DASH?
As long as DASH holds above the $39.58 support zone, the bullish harmonic structure remains intact. Continued strength above the 100 MA would likely reinforce buyer confidence and keep the CD leg in play.
If momentum persists, the Bearish Butterfly projection points toward the Potential Reversal Zone (PRZ) between $44.73 and $47.38. This area represents the typical completion zone for the pattern and offers an upside window of roughly 14% from current levels before sellers may attempt to regain control.
On the flip side, a breakdown below $39.58 would weaken the bullish outlook and risk invalidating the harmonic structure. Such a move could expose DASH to renewed downside pressure and delay any sustained recovery attempt.
For now, DASH’s ability to hold above reclaimed moving average support and continue building higher lows will be critical in determining whether this recovery can extend further in the sessions ahead.
Disclaimer: The views and analysis presented in this article are for informational purposes only and reflect the author’s perspective, not financial advice. Technical patterns and indicators discussed are subject to market volatility and may or may not yield the anticipated results. Investors are advised to exercise caution, conduct independent research, and make decisions aligned with their individual risk tolerance.
Disclaimer: The information on this page may come from third parties and does not represent the views or opinions of Gate. The content displayed on this page is for reference only and does not constitute any financial, investment, or legal advice. Gate does not guarantee the accuracy or completeness of the information and shall not be liable for any losses arising from the use of this information. Virtual asset investments carry high risks and are subject to significant price volatility. You may lose all of your invested principal. Please fully understand the relevant risks and make prudent decisions based on your own financial situation and risk tolerance. For details, please refer to
Disclaimer.
Related Articles
Crypto consolidates as volatility cools and futures markets tilt bearish
The crypto market continued to exhibit signs of choppiness on Friday, with bitcoin BTC$67,135.03 trading at $67,000 in the middle of a trading range that spans back to early February.
A selection of altcoins picked up during the lower liquidity Asia hours, prompting the likes of ALGO and RENDER to
CoinDesk1h ago
XRP Eyes $1.50 Breakout as Price Holds Critical Range
XRP trades in a tight range, testing support near $1.33 and resistance $1.40–$1.42.
A breakout above $1.50 could signal bullish momentum toward $1.52–$1.60.
Breakdown below $1.27 may extend the current downtrend and increase selling pressure.
Ripple’s XRP continues to trade within a
CryptoNewsLand2h ago
CryptoQuant: Ethereum derivatives market net traders trading volume turns positive, buyer pressure reaches $104 million
On April 4, CryptoQuant analyst Darkfrost posted a message, pointing out that the Ethereum derivatives market is showing a “structural change.” The net trader execution volume has turned positive for the first time, with buy-side pressure in control, which could help form a market bottom and may kick off a new round of upside.
GateNews2h ago
VanEck Research Director: BTC derivative protective demand hits the 99th percentile historically, signaling a potential contrarian long setup
VanEck Research head Matthew Sigel said that demand for hedging in the Bitcoin derivatives market has reached the 99th percentile in history, suggesting that it may be suitable to establish long positions. At the same time, he warned that high capital expenditures in the artificial intelligence sector could put pressure on the market, especially in the S&P 500.
GateNews4h ago
Bitcoin’s ‘no direction’ action may lead to heavier breakout: Analyst
Bitcoin's prolonged consolidation below $70,000 may indicate a potential rally, despite mixed analyst sentiment. While some predict a breakout, others warn of deeper bearish trends. Current trading is stagnant, with Bitcoin at $66,890.
Cointelegraph5h ago
