
Date: Sat, Dec 27, 2025 | 10:25 AM GMT
Dash (DASH), the privacy-focused token, has struggled alongside the broader altcoin market over the past month, shedding nearly 35% of its value amid persistent selling pressure. However, price action is now starting to stabilize, with DASH trading in the green today and posting a modest 4% recovery. More importantly, the latest chart structure suggests that the recent rebound may not be just a short-lived bounce, but part of a developing bullish setup.
Source: Coinmarketcap
Harmonic Pattern Hints at Potential Upside
On the 4-hour timeframe, DASH is forming a Bearish Butterfly harmonic pattern. While the name may sound negative, this pattern typically allows for a strong upside move during its CD leg before price reaches the final reversal zone.
The structure began at Point X near $42.64, followed by a sharp decline into Point A. From there, DASH rebounded toward Point B, where sellers briefly reasserted control, before price dipped once again into Point C around $36.17. This region has since acted as a firm base, with buyers stepping in aggressively to defend the lows.
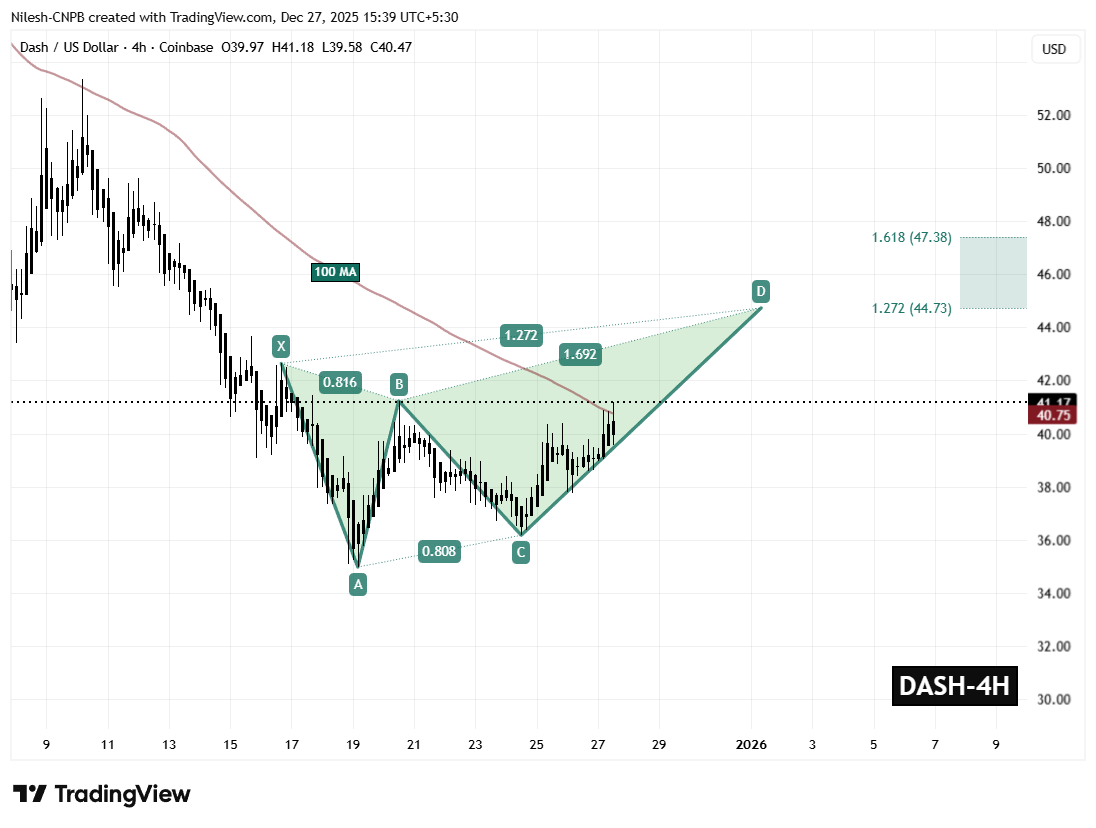
Dash (DASH) 4H Chart/Coinsprobe (Source: Tradingview)
From Point C, DASH has staged a steady recovery and is currently trading near $41.17. This move indicates improving momentum and suggests that the CD leg of the harmonic structure is actively unfolding.
Adding further strength to this setup is DASH’s successful reclaim of the 100-period moving average near $40.75. This level had previously acted as dynamic resistance throughout the downtrend, and flipping it into support marks a meaningful shift in short-term market structure.
What’s Next for DASH?
As long as DASH holds above the $39.58 support zone, the bullish harmonic structure remains intact. Continued strength above the 100 MA would likely reinforce buyer confidence and keep the CD leg in play.
If momentum persists, the Bearish Butterfly projection points toward the Potential Reversal Zone (PRZ) between $44.73 and $47.38. This area represents the typical completion zone for the pattern and offers an upside window of roughly 14% from current levels before sellers may attempt to regain control.
On the flip side, a breakdown below $39.58 would weaken the bullish outlook and risk invalidating the harmonic structure. Such a move could expose DASH to renewed downside pressure and delay any sustained recovery attempt.
For now, DASH’s ability to hold above reclaimed moving average support and continue building higher lows will be critical in determining whether this recovery can extend further in the sessions ahead.
Disclaimer: The views and analysis presented in this article are for informational purposes only and reflect the author’s perspective, not financial advice. Technical patterns and indicators discussed are subject to market volatility and may or may not yield the anticipated results. Investors are advised to exercise caution, conduct independent research, and make decisions aligned with their individual risk tolerance.
Disclaimer: The information on this page may come from third parties and does not represent the views or opinions of Gate. The content displayed on this page is for reference only and does not constitute any financial, investment, or legal advice. Gate does not guarantee the accuracy or completeness of the information and shall not be liable for any losses arising from the use of this information. Virtual asset investments carry high risks and are subject to significant price volatility. You may lose all of your invested principal. Please fully understand the relevant risks and make prudent decisions based on your own financial situation and risk tolerance. For details, please refer to
Disclaimer.
Related Articles
Schwab says even a 1% crypto allocation can reshape portfolio risk
Charles Schwab's research highlights that cryptocurrency allocation in portfolios relies more on investors' risk tolerance than return forecasts. With high volatility, even small crypto allocations can significantly affect portfolio risk, though they remain speculative investments.
CoinDesk15m ago
BTC 15-minute drop of 0.51%: short-term capital outflow and macro volatility converging to trigger a pullback
Between 2026-04-07 14:00 and 2026-04-07 14:15 (UTC), the BTC price fluctuated within the range of 67801.3 - 68256.1 USDT. The candlestick chart recorded a -0.51% return, with an amplitude of 0.67%. Short-term volatility intensified, and market attention increased significantly. Overall liquidity was still within the normal range, but showed marginal changes.
The main drivers of this unusual move are the combined effect of short-term capital outflows and the simultaneous rise in net inflows to exchanges. Short-term holders take profit or cut losses at market volatility nodes, pushing prices lower. Spot
GateNews38m ago
'A whole civilization will die': Crypto markets under pressure as Trump ups rhetoric towards Iran
Bitcoin has fallen to around $68,000 after hitting over $70,000, coinciding with Trump's Iran deadline. U.S. stock futures also declined, while oil prices rose. Vance's comments tempered market reactions, stating military goals in Iran were met.
CoinDesk1h ago
Analyst Says Five Years of Nothing for Ethereum and Altcoin Will Finally End Soon
Analyst says five years of nothing for Ethereum and altcoins will end soon.
This means the altseason peak phase is nearing.
How far can the price of ETH pump this year?
Expectations for altseason to play out this year remain strong despite the many calls for the bear market to have
CryptoNewsLand2h ago
Onchain Perp DEX Volume Falls for Fifth Straight Month as March Drops to $699B
Onchain perpetual futures trading has sharply declined for five consecutive months, with March 2026 volume dropping to $699 billion from a peak of $1.36 trillion in October 2025. Hyperliquid dominates the market, capturing 34% of recent trading activity.
CryptoNewsFlash2h ago
Bitcoin Tests Long-Term Holder Resilience Near Key Support Levels
Bitcoin is testing a crucial support level at $67,675, just $1,000 away, amidst a -44.8% drawdown. The outcome may dictate future price movements, with a potential correction to $54,000-$58,000 if breached. Historical patterns reveal Bitcoin's cyclical volatility.
BlockChainReporter2h ago
