
Date: Sun, Dec 28, 2025 | 11:20 AM GMT
The broader cryptocurrency market is showing modest strength, with both Bitcoin (BTC) and Ethereum (ETH) trading in the green. This steady performance among major assets has helped stabilize overall market sentiment, creating room for select altcoins — including Worldcoin (WLD) — to develop constructive technical setups.
At the time of writing, WLD is trading with a modest intraday gain. More importantly, a notable whale accumulation combined with an improving lower-timeframe structure suggests that momentum may be shifting in favor of the bulls.
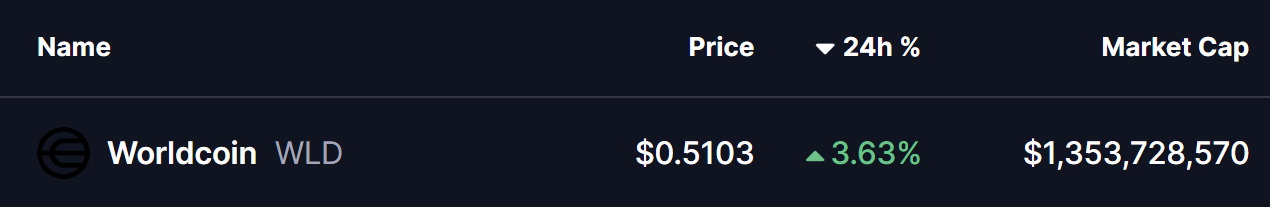
Source: Coinmarketcap
Major Accumulation
On-chain data has added an extra layer of confidence to WLD’s current setup. According to Lookonchain, on December 25, a wallet (0xf000) linked to Multicoin Capital spent $30 million USDC to acquire 60 million WLD at an average price of $0.50 through an OTC deal.
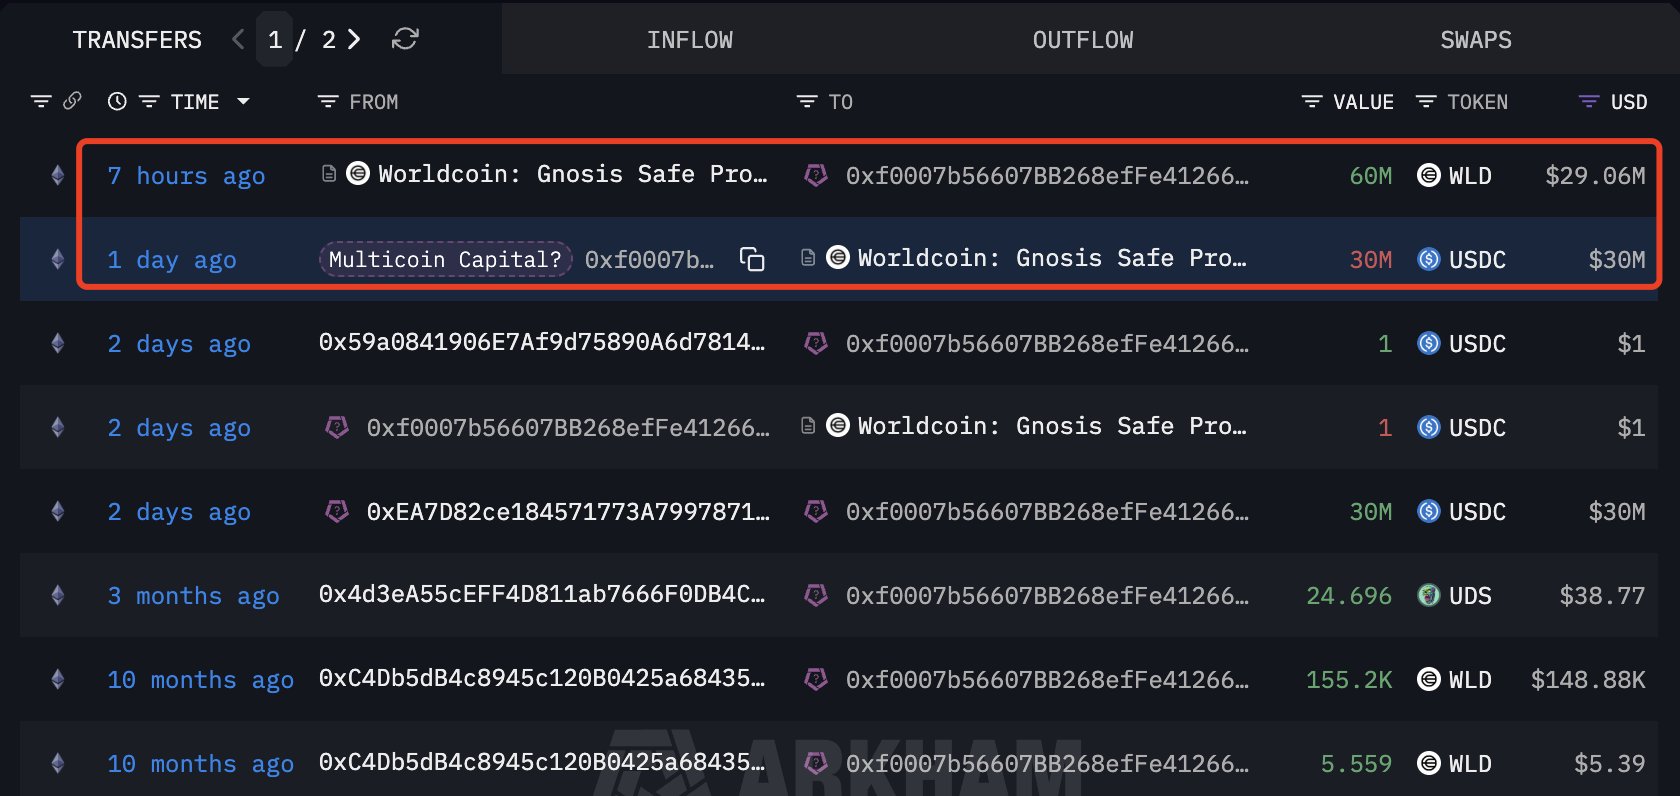
Source: @lookonchain (X)
Such large-scale accumulation near key support levels often signals long-term conviction rather than short-term speculation.
Adam and Eve Pattern in Play
On the 4-hour chart, WLD is forming a textbook Adam and Eve double bottom pattern — a bullish reversal structure that frequently marks the end of downtrends.
The pattern began after WLD faced rejection from the $0.5202–$0.5290 resistance zone. The initial decline was sharp and aggressive, forming the V-shaped “Adam” bottom near the $0.47 region. This was followed by a second, more rounded decline — the “Eve” portion — which bottomed at a similar price level, reinforcing strong demand in that zone.

Worldcoin (WLD) 4H Chart/Coinsprobe (Source: Tradingview)
Since completing the second bottom, WLD has steadily pushed higher, reclaimed the 50-period moving average, and is now carving out the right side of the structure near $0.5106. Price is currently pressing against the neckline area, signaling that a decisive move may be approaching.
What Next for WLD?
If WLD continues to hold above the 50 MA support near $0.5013, the bullish structure remains intact. A clean breakout above the $0.5290 neckline, ideally followed by a successful retest, would confirm the Adam and Eve pattern.
Once confirmed, the projected measured move points toward the $0.58 region, suggesting a potential upside of roughly 13% from current levels. This aligns closely with the projected path shown on the chart and would mark a meaningful trend shift on the lower timeframe.
On the flip side, failure to hold the 50 MA could delay the breakout scenario and keep WLD range-bound in the near term. As long as that support holds, however, the technical bias remains tilted to the upside.
Disclaimer
The views and analysis presented in this article are for informational purposes only and reflect the author’s perspective, not financial advice. Technical patterns and indicators discussed are subject to market volatility and may or may not yield the anticipated results. Investors are advised to exercise caution, conduct independent research, and make decisions aligned with their individual risk tolerance.
About Author
Nilesh Hembade is the Founder and Lead Author of Coinsprobe, with over 5 years of experience in the cryptocurrency and blockchain industry. Since launching Coinsprobe in 2023, he has been providing daily, research-driven insights through in-depth market analysis, on-chain data, and technical research.

Disclaimer: The information on this page may come from third parties and does not represent the views or opinions of Gate. The content displayed on this page is for reference only and does not constitute any financial, investment, or legal advice. Gate does not guarantee the accuracy or completeness of the information and shall not be liable for any losses arising from the use of this information. Virtual asset investments carry high risks and are subject to significant price volatility. You may lose all of your invested principal. Please fully understand the relevant risks and make prudent decisions based on your own financial situation and risk tolerance. For details, please refer to
Disclaimer.
Related Articles
Bitcoin holds at 67,500 USD as Trump hints that the Iran war could end
Bitcoin remains stable around $67,500 as speculation grows about Donald Trump's potential to de-escalate tensions with Iran. This stability reflects a cautious investor sentiment amid broader market volatility driven by geopolitical concerns.
TapChiBitcoin8m ago
Bitcoin holds at $67,500! Trump sends out a ceasefire signal—what will the market do next?
On March 31, 2026, the Bitcoin price has been trading in the vicinity of $67,500, showing a certain level of resilience despite uncertainty surrounding the situation in the Middle East. The market is watching for signals from Trump regarding an end to the Iran conflict, which is boosting sentiment for risk assets. Volatility in global markets is increasing, and the crypto market continues to perform better than traditional assets. Analysis suggests that Bitcoin has strong shock-absorbing capacity. Going forward, attention will be on the progress of the war and its impact on liquidity and inflation.
GateNews10m ago
Bitcoin ETF ends a seventh consecutive red day, and selling pressure on the Bitcoin price returns again
After recent U.S. spot Bitcoin ETFs saw net inflows for seven straight trading days, they then experienced a sharp outflow. On the 18th, there was a net outflow of $163.5 million; on the 19th, it again saw a net outflow of $51.90 million, indicating that both market capital and prices have weakened at the same time. Bitcoin’s price briefly fell below $70,000, highlighting that the ETF’s capital inflows can no longer support its rebound, and that a deteriorating macro environment behind the scenes has created pressure on risk assets, causing investors’ preferences to clearly contract. The $70,000 level being tested has become a bellwether for short-term market sentiment.
区块客18m ago
MICA Daily|ETH volatility continues to stay flat, falling to its lowest level since January last year
Binance’s ETH 30-day realized volatility index has fallen to about 0.62, indicating that the market has entered a quiet period, with volatility decreasing. The Z-Score volatility is -0.43, suggesting that current volatility is below the historical average. Low-volatility periods may signal an increased likelihood of sharp price moves in the future, especially when trading volume or liquidity spikes.
区块客44m ago
Analyst: TD Sequential Flashes Buy Signals for These 2 Popular Altcoins
Two of the largest and most popular altcoins might be prone to big upward moves ahead, at least according to Ali Martinez, who outlined the TD Sequential as the indicator suggesting these breakouts.
Namely, those are DOGE, which continues to struggle well below $0.10, and ADA, which has fallen
CryptoPotato48m ago
Sell-off warning lights up red! 47% of circulating Bitcoin is “trapped,” and long-term holders are also cutting losses and exiting
The cryptocurrency market is facing a cold wind, with nearly half of Bitcoin already falling below cost, and long-term investors have also begun selling at a loss. The Bitcoin Impact Index has risen to 57.4, indicating that market pressure is intensifying; in similar historical cases, it has often preceded a large-scale sell-off that is about to come. Short-term holders are down 47%, liquidity momentum is weakening, and stablecoin outflows have turned into net inflows, reversing course.
区块客52m ago
