
Date: Fri, Dec 26, 2025 | 06:30 PM GMT
The broader cryptocurrency market has been navigating a period of choppy and uncertain price action over the past several weeks, a phase that began after the sharp market-wide sell-off on October 10. During that correction, Ethereum (ETH) dropped nearly 28% over the last 60 days, applying sustained pressure across the altcoin sector — including ether.fi (ETHFI).
ETHFI has mirrored this weakness, sliding more than 31% over the same period. However, despite the sharp downtrend, recent price behavior suggests selling pressure may be easing. The token is now trading near a historically significant demand zone, where buyers have repeatedly stepped in before — raising the possibility that ETHFI could be approaching an inflection point.
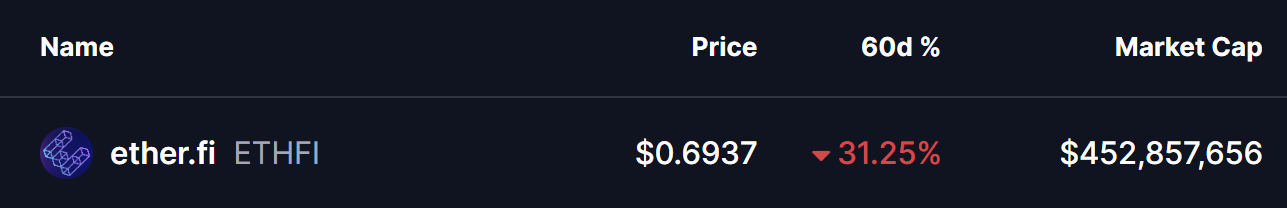
Source: Coinmarketcap
Double Bottom Pattern in Focus
On the daily timeframe, ETHFI appears to be forming a potential double-bottom structure — a classic reversal pattern that often signals exhaustion among sellers. The setup began after ETHFI was rejected from the $0.9233 resistance area, a move that triggered a sharp decline of nearly 28% and pushed price back toward the lower end of its range.
That sell-off dragged ETHFI into the $0.65 support zone, a level that has consistently acted as a strong demand area in the past. The chart now shows price revisiting this same region and stabilizing once again, suggesting buyers are actively defending it. The similarity between the first and second lows strengthens the case that a double-bottom base may be forming.
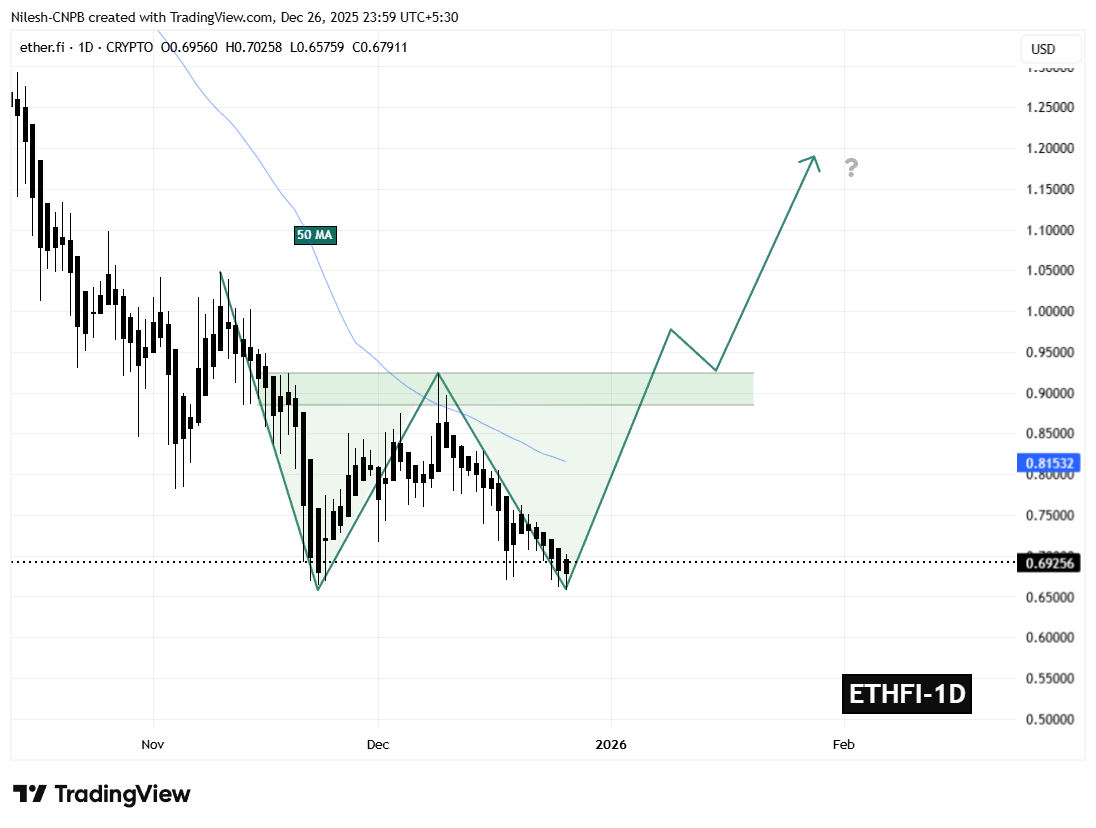
ETHFI Daily Chart/Coinsprobe (Source: Tradingview)
If this support continues to hold, the ongoing consolidation could mark the completion of the second bottom — a critical step in shifting momentum away from sellers and toward a potential trend reversal.
What’s Next for ETHFI?
The $0.65 support zone remains the most important level to monitor in the near term. As long as ETHFI holds above this area, the developing bullish structure remains valid and provides room for momentum to gradually rebuild.
On the upside, the first major challenge sits at the 50-day moving average near $0.8153. This level has repeatedly capped recovery attempts throughout the recent downtrend and now represents the initial test for buyers. A sustained move above this moving average would signal improving market structure and growing bullish confidence.
Beyond that, the $0.9233 neckline stands as the key confirmation level. A decisive breakout above this resistance would complete the double-bottom pattern and significantly strengthen the bullish outlook, potentially opening the door for a broader recovery move in the weeks ahead.
For now, ETHFI finds itself at a technically pivotal zone — one that could either reinforce the existing downtrend or mark the beginning of a meaningful rebound if buyers continue to defend support.
Disclaimer: The views and analysis presented in this article are for informational purposes only and reflect the author’s perspective, not financial advice. Technical patterns and indicators discussed are subject to market volatility and may or may not yield the anticipated results. Investors are advised to exercise caution, conduct independent research, and make decisions aligned with their individual risk tolerance.
Disclaimer: The information on this page may come from third parties and does not represent the views or opinions of Gate. The content displayed on this page is for reference only and does not constitute any financial, investment, or legal advice. Gate does not guarantee the accuracy or completeness of the information and shall not be liable for any losses arising from the use of this information. Virtual asset investments carry high risks and are subject to significant price volatility. You may lose all of your invested principal. Please fully understand the relevant risks and make prudent decisions based on your own financial situation and risk tolerance. For details, please refer to
Disclaimer.
Related Articles
Bitcoin Tapped $69K, Oil Prices Ended March With 60% Surge: Market Watch
Bitcoin jumped to a new multi-day peak of over $69,200 earlier today as the markets prepare for Trump’s highly anticipated speech on the war against Iran.
Most larger-cap alts are also in the green, with ETH climbing past $2,100 and XRP defending the $1.30 support. ZEC and HBAR have posted the
CryptoPotato37m ago
BTC’s trading price is 21% above the realized price, the lowest premium level in the past three years
Gate News, April 1, BTC’s current trading price is 21% higher than its realized price (the average purchase cost of all circulating BTC). Data shows that BTC’s realized price is $54,286, and the current premium level is the lowest in the past three years, with a premium performance close to the historical cycle’s bottom-range behavior.
GateNews43m ago
Can this rebound in U.S. stocks hold up? The last day of Q1 surged 3% to close, but over the past month it’s crashed 5%.
March 31 saw a sharp jump in the three major U.S. stock indexes, with the Dow surging by more than 1,125 points and posting its best single-day performance. However, the S&P 500 fell 5.09% for the month of March, the worst performance since 2022, and market confidence remained weak. The VIX volatility index stayed elevated, suggesting investors are still on high alert. Soaring oil prices weighed on Asian markets; in March, capital outflows totaled $52 billion, with Taiwan hit the hardest. As the April earnings reporting season approaches, the market’s outlook remains unclear.
動區BlockTempo50m ago
Peter Schiff Updates His Gold Price Prediction for April
Gold just closed its worst month since 2008. In march, we saw gold had heavy dips, with prices falling into the low $4,000s before a dramatic reversal. But in the last week of the month, gold caught fire, rallying nearly 15 percent from the March 23 bottom. Now, the gold price is
CaptainAltcoin1h ago
