As of Wednesday writing, Bitcoin Cash (BCH) is trading around $600, opening the possibility of forming a double bottom pattern on the daily chart. This coin has seen capital flow back into futures contracts, along with a positive funding rate, reflecting increased interest from investors. From a technical perspective, if the current momentum is maintained, BCH has the potential to reach the $655 zone, promising a promising upward move.
Retail investor sentiment turns positive
Bitcoin Cash is showing initial signs of renewed participation from retail investors, aligning with the positive recovery trend this week. In the market context, the combination of a positive funding rate and rising open interest (OI) often indicates that the asset has potential for further appreciation. According to data from CoinGlass, BCH futures open interest has increased to $746.29 million, up from $700.06 million on Tuesday, indicating higher risk levels as investors anticipate further profits.
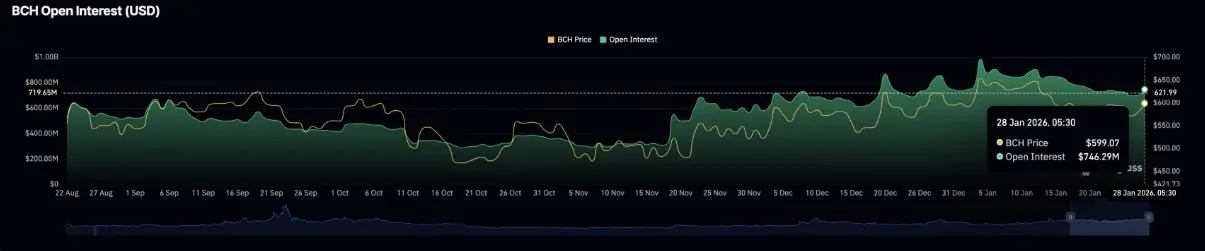 Open interest (OI) volume data for BCH | Source: CoinGlassThe upward trend is further supported as the funding rate remains positive at 0.0028%, reflecting market optimism and readiness to open new positions.
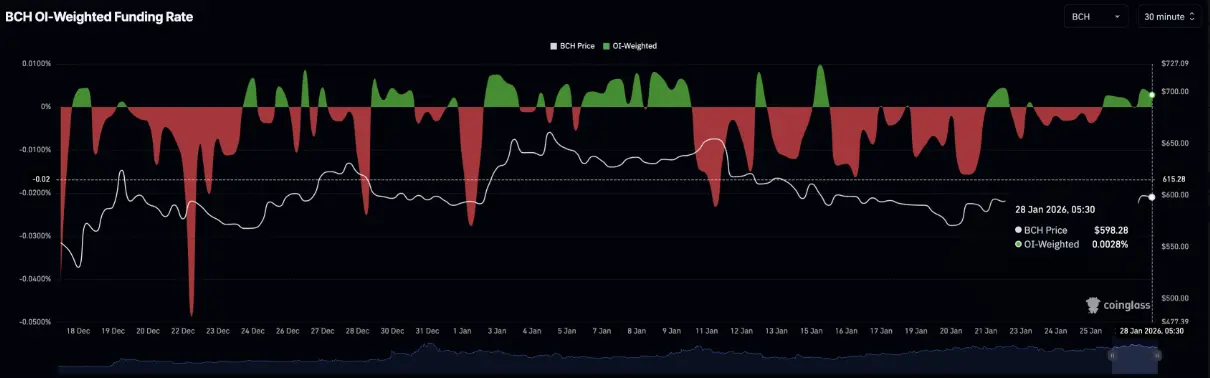 BCH funding rate | Source: CoinGlass## Bitcoin Cash recovery stalls around $600
Bitcoin Cash is currently trading around $600, holding steady above the 50, 100, and 200-day EMAs, reinforcing the long-term bullish trend signal. Retracements from the 100-day EMA at $575 have formed a double bottom pattern on the daily chart, with the neckline at the $606 peak on January 16. A daily close above this level could open the door for a breakout, targeting the Pivot R1 level at $655, which was an important resistance level earlier in January.
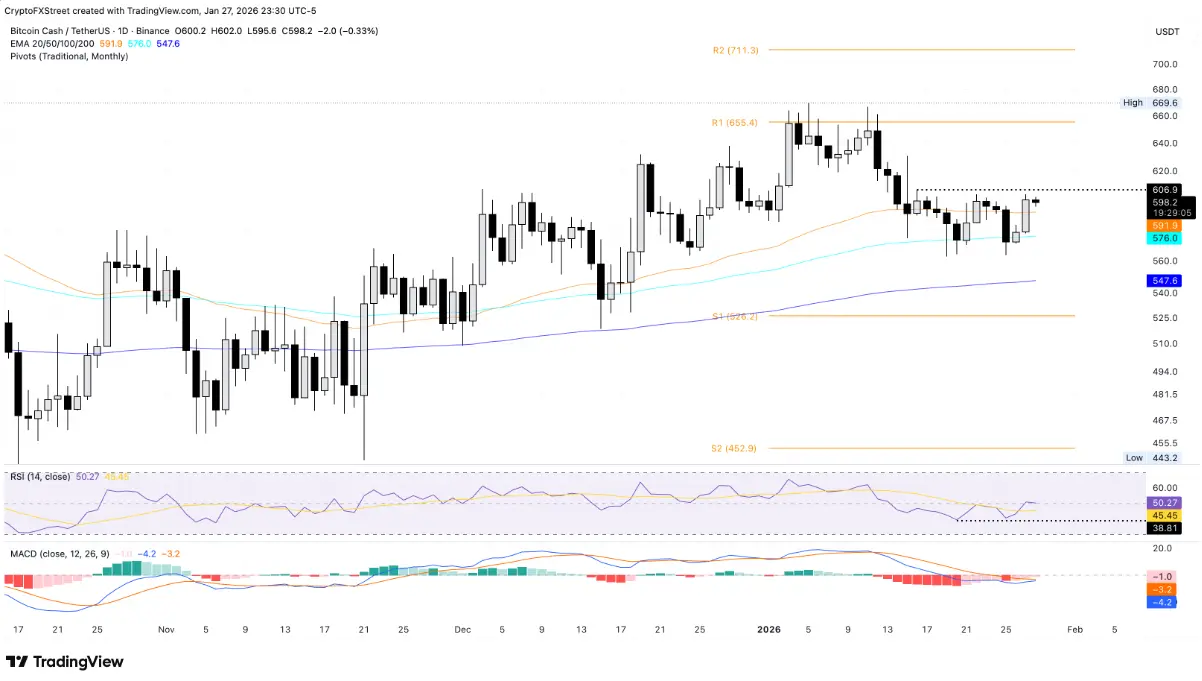 Daily BCH/USDT chart | Source: TradingViewTechnical indicators on the daily chart show selling pressure easing, hinting at an early signal of a potential uptrend formation. The RSI remains around 50, in the neutral zone, reflecting weakening selling pressure. The MACD is turning upward near the signal line, with the negative histogram shrinking, warning of a possible bullish crossover. When the histogram crosses above zero, a buy signal will be confirmed.
On the downside, if BCH falls below the 100-day EMA at $575, the decline could continue toward the 200-day EMA around $547.
- Gold demand spills over into the crypto whale market when reaching extreme scarcity levels
- This is why Bitcoin’s “Uptober” moment might actually start in February
SN_Nour
Disclaimer: The information on this page may come from third parties and does not represent the views or opinions of Gate. The content displayed on this page is for reference only and does not constitute any financial, investment, or legal advice. Gate does not guarantee the accuracy or completeness of the information and shall not be liable for any losses arising from the use of this information. Virtual asset investments carry high risks and are subject to significant price volatility. You may lose all of your invested principal. Please fully understand the relevant risks and make prudent decisions based on your own financial situation and risk tolerance. For details, please refer to
Disclaimer.