How to use the bottom-fishing pattern - rounding bottom
The advanced subject of Futures Trading, Gate learn, aims to help users to build a framework system of technical analysis, including candlesticks patterns fundamentals, technical patterns, averages and trendlines, and the application of technical indicators. In this issue, we will explain the application of the Rounding Bottom pattern regarding its concept, characteristics, BTC application, and relevant precautions.
What is a Rounding Bottom pattern?
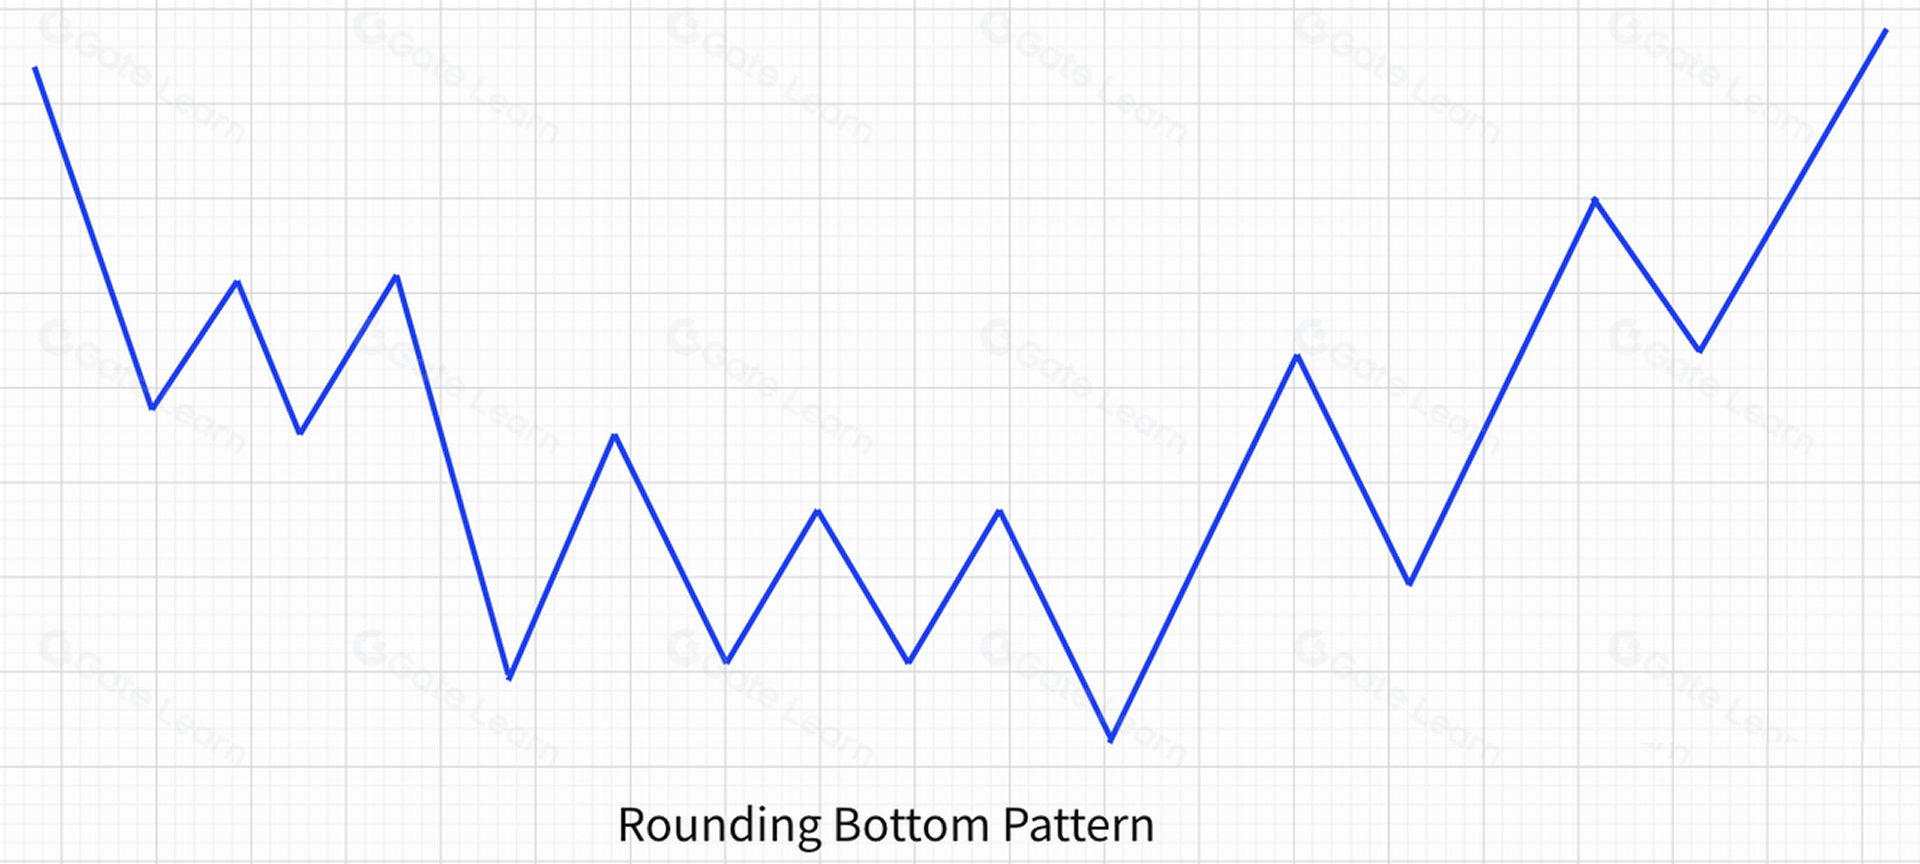
In a Rounding Bottom, the price falls increasingly slower and the trading volume shrinks, then the price stops falling and starts to rise slowly . After a period of horizontal price movement at the bottom, the speed increases faster and faster, and the volume gradually enlarges with the rise of the price. Rounding Bottom comes from its graphical shape of “U”, as shown in the figure below:
The technical characteristics of the Rounding Bottom
- It may appear at the end of the downward trends, or in the middle of the upward trends.
- The price falls and rebounds quickly at first. As the buyers’ participation decreases, the strength of the fall and rebound gradually becomes weaker, and then it remains sideways. It is only when new money enters the market that the price starts to turn up slightly and begins to rise, and then more money enters the market, pushing the price rapidly up.
- The trading volume gets increasingly smaller as the downtrend slows down, shrinks to a minimum when it goes sideways, and then gradually increases as the price rises. When the price accelerates upward, the volume also increases significantly. On the candlestick pattern, the volume histogram is graphically often circular in shape.
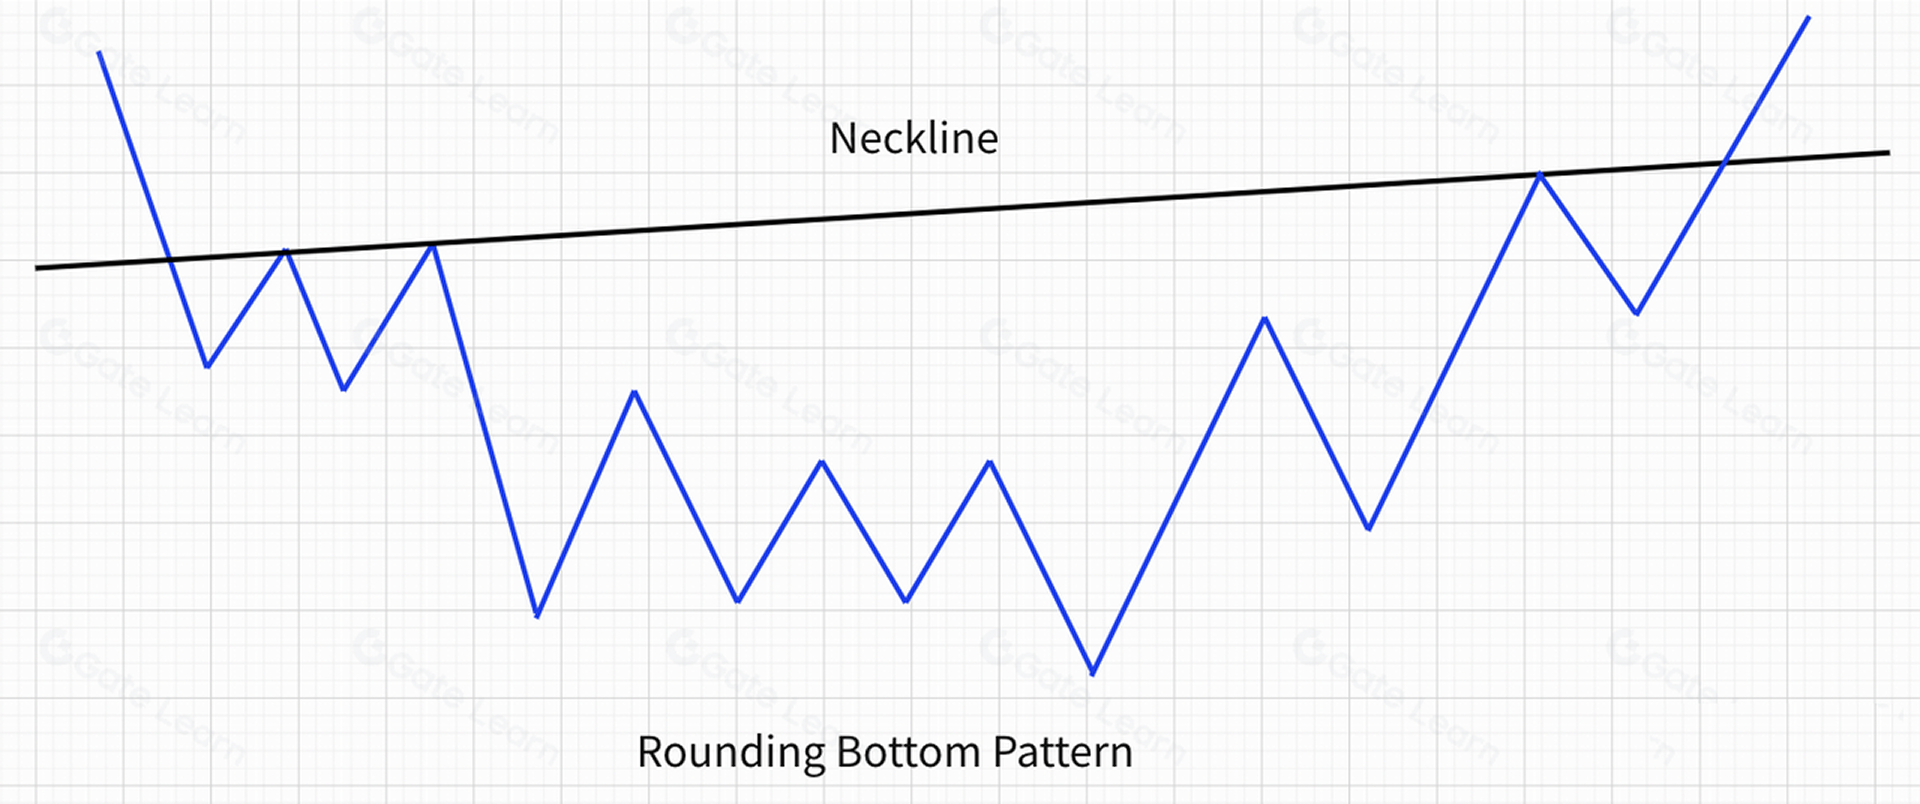
- The highest point of the Rounding Bottom is called the “Neckline”, as shown in the figure below.
The technical meaning of the Rounding Bottom
- The Rounding Bottom is a reliable signal of a turnaround. Traders can go long when the price effectively breaks through the Neckline. Also, when the Rounding Bottom has not been fully formed, traders can choose the right timing to gradually go long according to other trends and technical analysis tools.
- The new round of uptrend after the Rounding Bottom is often reliable, lasting, fast, and fierce, which is easier for traders to grasp and profit. However, since the formation of the rounding bottom is slow and lacks volatility, traders will often ignore it or give up due to a lack of patience.
Practical application of the Rounding Bottom
The longer the rounding bottom is formed, the more sufficient momentum will be accumulated, and when it breaks upward, the more powerful and durable the market rise will be as shown in the following chart:
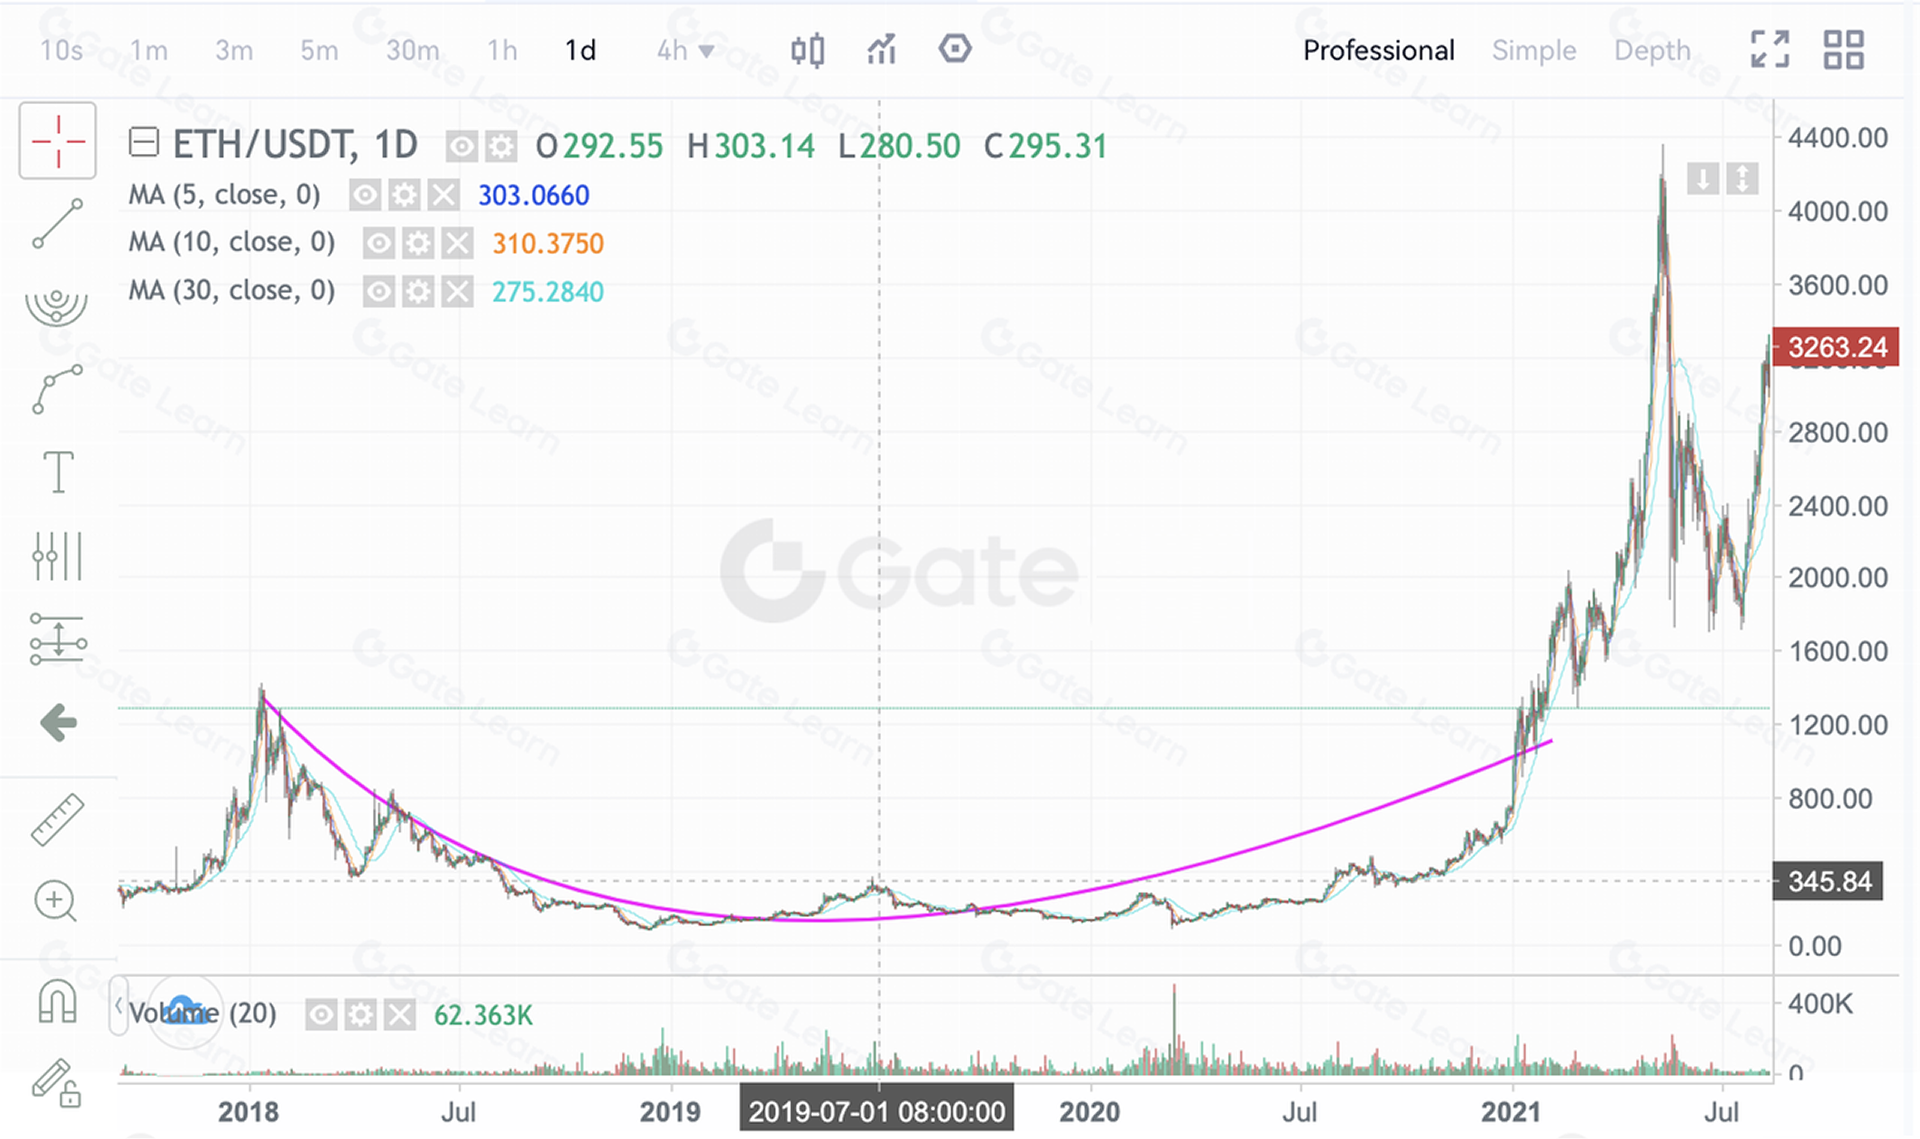
Reviewing the ETH market condition, it fell from a high of $1300 to a low of $81 from 2018.1 to 2019.1, a drop of up to 90% or more in just one year. From 2019.1 to 2020.3, ETH was in the bottom price range of $100-$400, with sideways oscillation for up to a year. From a technical point of view, the whole trend constructed a standard rounding bottom and lasted for 1 year, which built up sufficient energy for the after-market to outburst. And then, 2020.3 marked an usher in a super bull market with a cumulative gain of more than 5000%.
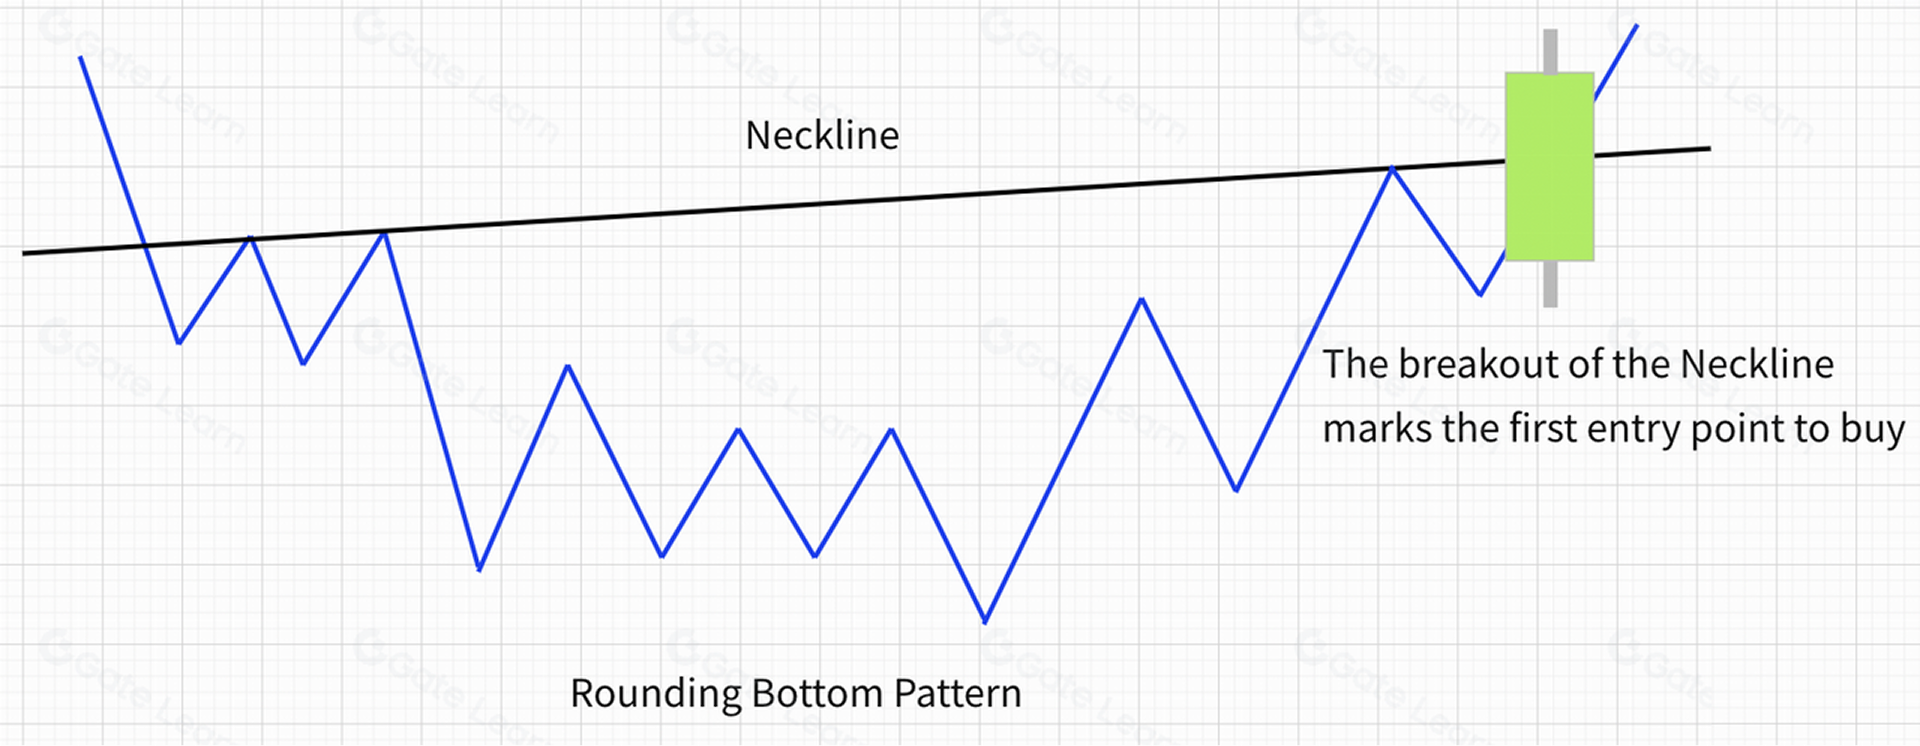
Rounding Bottom entry point 1: the breakout of the Neckline marks the first entry point to buy.
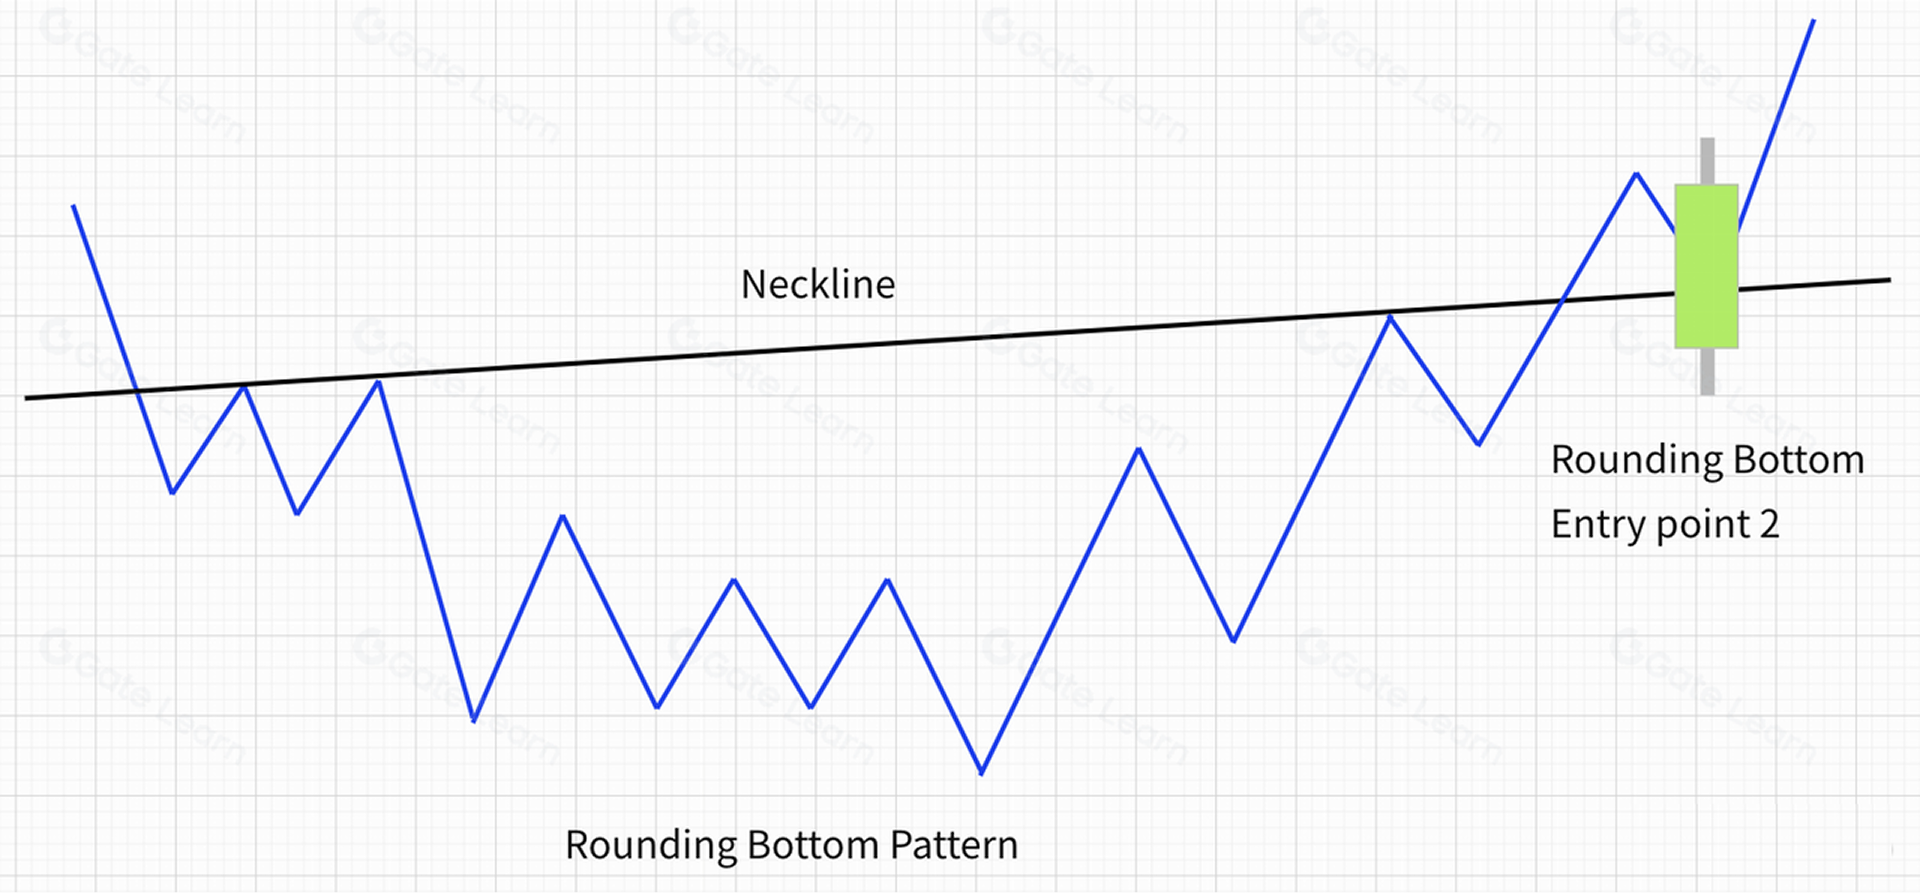
Rounding bottom entry point 2: when the price breaks through the Neckline of the rounding bottom, aggressive buyers enter the market, at which point the price usually falls back, and when the Neckline is stabilized again, it marks the buy entry point 2 as shown in the figure below.
some rounding bottom patterns will give an entry signal before the price breaks through the neckline, so you don’t have to wait for the price to break through the rounding bottom neckline before entering the market. This is mainly because rounding bottoms take a long time to form and other technical patterns have already been formed by that time. Usually, it will break the medium and long-term downtrend line, so you can combine it with other technical indicators to ensure higher reliability.
- After the formation of the rounding bottom, the time and strength of the market and the bottoming period are often positively correlated, that is, the longer the period of the formation of the rounding bottom, often the greater the market rise, and the longer the rise cycle. As the saying goes, “the longer the crypto is sideways, then the higher the price will rise”.
- If there is no trading volume when the Neckline is broken, it is likely to come out of a failed rounding bottom.
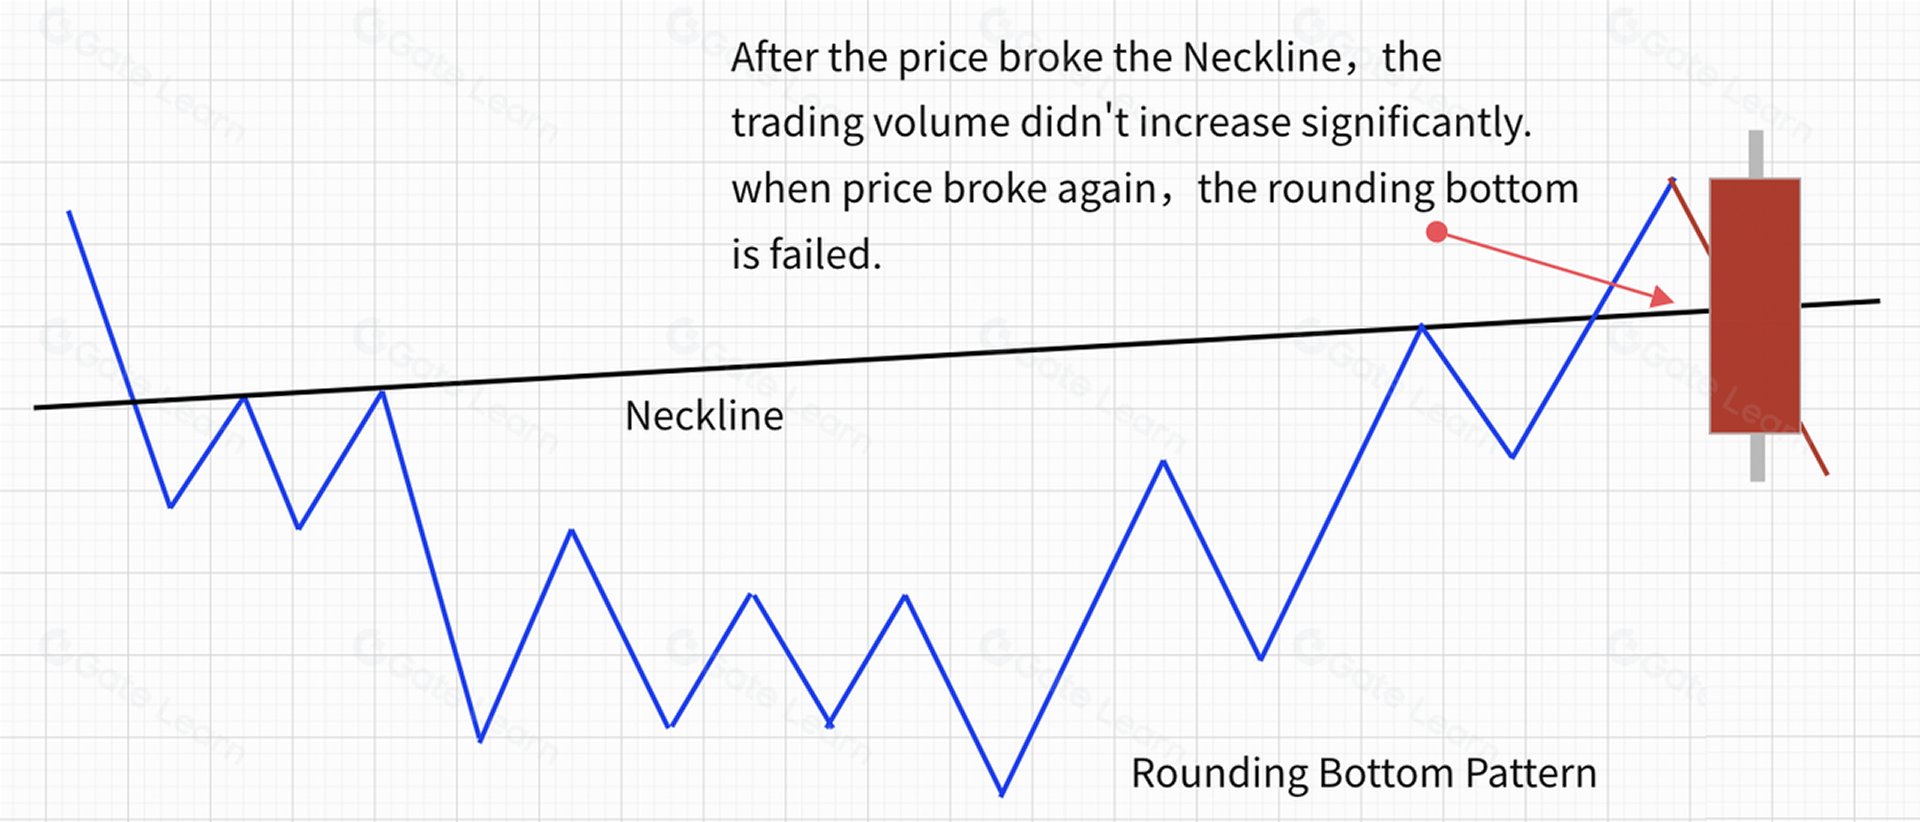
The price trend formed a near-perfect rounding bottom, but the price failed to break through effectively and closed negative when it met the Neckline resistance, then the price went down, indicating a failure of the rounding bottom breakout.
Summary
Rounding bottom patterns are more common in the market, especially in bear market bottoms to take longer to build. This is because, after a round of bearish market, the capital side and investor confidence will take a longer time to adjust. However, once a rounding bottom is successfully formed, it is a very reliable signal to enter the market and take advantage of the going long opportunities.
For more information on futures trading, please visit the Gate futures platform and register to start your futures trading journey.
Disclaimer
This is for your reference only. The information provided by Gate above is not investment advice and is not responsible for any investment you may make. The information regarding technical analysis, market judgments, trading tips, and trader sharing may involve potential risks, investment variables, and uncertainties, and this issue does not provide or imply any opportunity for guaranteed returns.
Lesson 1:What is Crypto-Market Technology Analysis
Lesson 2:Several Bullish Candlestick Patterns
Lesson 3:Several Bearish Candlestick Patterns
Lesson 4:How to use the bottom-fishing pattern - head and shoulders bottom
Lesson 5:How to use the bearish reversal pattern - head and shoulders top
Lesson 6:How to use the bottom-fishing pattern - rounding bottom
Lesson 7:How to use the bearish reversal pattern - rounding top
Lesson 8:How to use the bottom-fishing pattern - double bottom (W-shape)
Lesson 9:How to use the bearish reversal pattern - double top (M-shape)
Lesson 10:How to use the bottom-fishing pattern - V-shaped reversal
Lesson 11:How to use the continuation pattern - ascending triangle
Lesson 12:How to use the continuation pattern - descending triangle
Lesson 13:How to use the continuation pattern - other triangle pattern types
Lesson 14:How to use the continuation pattern - flag pattern
Lesson 15:15 How to use the continuation pattern - wedge pattern
Lesson 16:How to use the continuation pattern - rectangle pattern
Lesson 17:Mater technical analysis-Methodology
Related Courses

Tools That Help You Trade Better: Moving Averages, Trend Lines, and Indicators

Gate Futures Trading Guide - A must-read for newbies
ETF Leveraged Tokens — Product Guide

Futures Grid Trading User Guide