Original Title: “On-chain Data Academy (7): A New Trap, $BTC Magical Pricing Methodology Participated in by Ark (II)”
Original author: Mr. Beg, on-chain data analyst
If you are not familiar with Cointime Price, it is recommended to first read the first article: “On-chain Data Academy (Six): A trap new, BTC magical pricing methodology researched by Ark (I)”
TLDR
-
The Cointime Price series consists of three articles, and this is the second one.
-
This article will introduce the application method of Cointime Price in trapping the peak.
-
This article will introduce a personal deviation model designed by me.
I. Brief Review of Cointime Price
Cointime Price concept originates from Cointime Economics, using a “time-weighted” approach to assess the fair price of BTC.
Compared to pure LTH (Long-term Holder) and STH (Short-term Holder), Cointime Price is more elastic and sensitive, while this model can also effectively exclude the impact of BTC that has been lost since ancient times.
The first article provides a detailed introduction to Cointime Price and its bottom-fishing applications. If you have understood the concept, let’s officially dive into today’s topic: the top-fishing application.
II. Escape-the-Top Application Methodology: Cointime Price Deviation Model Design
Cointime Price Deviation (Cointime Price 偏离度) is one of the models I designed while researching on-chain data and has been applied in the weekly report of escape top analysis.
Related tweets: [Top-out Model Introduction](
The following text will explain the principles of model design and how to use this model to determine the BTC peak. All content in this article is original research, and the research process is not easy, so please support it.
1. Deviation of the current price from Cointime Price
Why measure the degree of deviation?
-
Cointime Price height represents the true holding cost of BTC chips, especially the holding cost of long-term holders (LTH).
-
Since long-term holders have a greater influence on the Cointime Price, when the current price of BTC is significantly higher than the Cointime Price, the motivation for long-term holders to take profits may increase, potentially triggering distribution behavior.
· Calculation formula: Deviation rate = (Current price - Cointime Price) / Current price
· Observe deviation rate (distribution ratio)
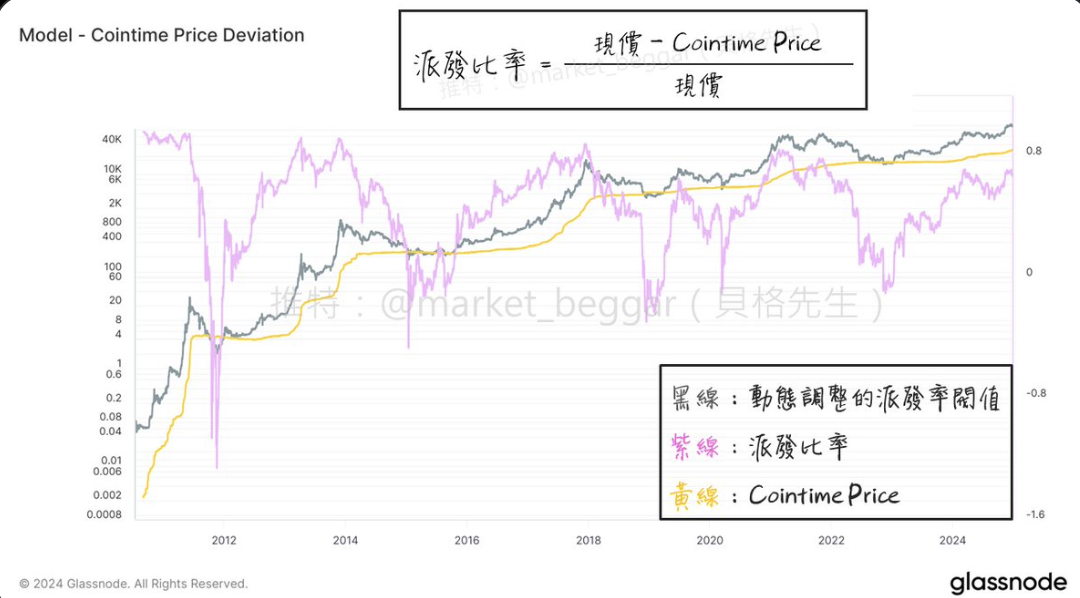
As shown in the figure, we can obtain the distribution ratio curve (purple line). We can see that: whenever the distribution ratio is at a high level, it often corresponds to the top of BTC.
So, how do we define “high position”? Next, we will use statistical methods to solve this problem.
2. Cointime Price Deviation Extreme Value Definition
If we observe historical data, we will find that the high points of Deviation are not fixed, and in each bull market, the peak value of Deviation slightly declines. Therefore, simply using a fixed value to define “high point” is not rigorous.
To solve this, I use the concept of “standard deviation” from statistics:
· Calculate the mean and standard deviation of historical Deviation data.
· Define “mean + n standard deviations” as “high position (top signal)” and denote it as Threshold.
· Perform moving average smoothing on Deviation data to reduce noise.
· When the average value of Deviation > Threshold, the top signal is triggered.
· Why Standard Deviation?
· The historical trend of Deviation exhibits mean reversion characteristics (as shown in the figure).
· Standard deviation measures volatility. When BTC price fluctuations decrease, the Threshold will also dynamically adjust, becoming more flexible.
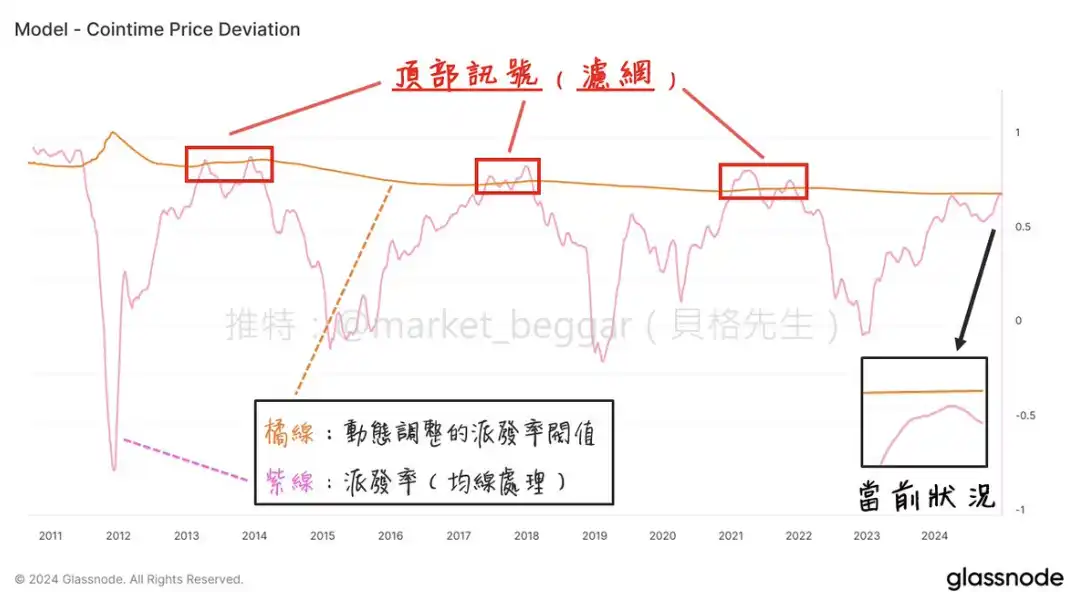
As shown in the figure above, after the above processing, we can obtain such a diagram.
· Supplementary explanation
-
In point 2 “mean + n standard deviations”, n is an adjustable parameter: the larger n is, the lower the probability of the peak signal appearing, and the model is stricter.
-
The moving average smoothing process in point 3: mainly filters short-term market fluctuations to enhance signal reliability.
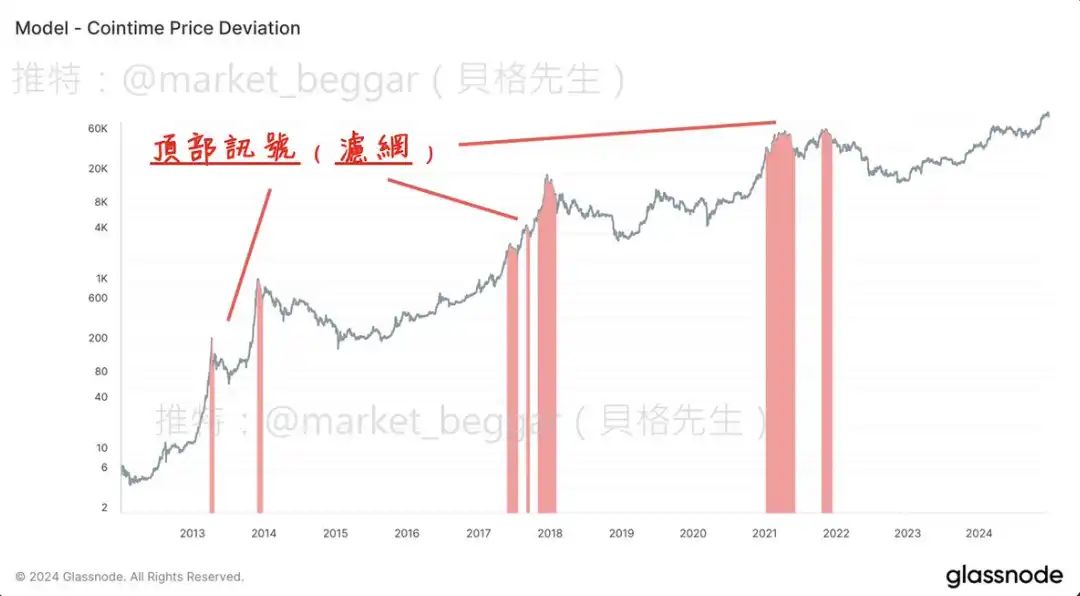
3. Trap Signal Example
As shown in the figure, when the purple line (distribution ratio) exceeds the orange line (Threshold), the corresponding BTC price is often at a stage high.
Three, Conclusion
This article is the second in the Cointime Price series, continuing the concepts from the previous text and sharing how individuals can use Cointime Price to design a top escape model.
· Summarize key points:
-
Cointime Price Deviation estimates the long-term holders’ selling pressure by quantifying the deviation between the current BTC price and the Cointime Price, used to determine the BTC top.
-
Use the “standard deviation” method to dynamically define top signals, ensuring the model is more adaptive.
-
The model has been practically applied to the weekly report and can effectively capture BTC high signals.
Future plans:
- The third article in this series will continue to explore the application of Cointime Price in market topping, stay tuned.
Original link
:
Disclaimer: The information on this page may come from third parties and does not represent the views or opinions of Gate. The content displayed on this page is for reference only and does not constitute any financial, investment, or legal advice. Gate does not guarantee the accuracy or completeness of the information and shall not be liable for any losses arising from the use of this information. Virtual asset investments carry high risks and are subject to significant price volatility. You may lose all of your invested principal. Please fully understand the relevant risks and make prudent decisions based on your own financial situation and risk tolerance. For details, please refer to
Disclaimer.
