- HYPE surged 125% in 24 hours with $221.58 million in trading volume.
- RSI at 38.70 suggests probable price reversal, while MACD shows weakening bearish momentum.
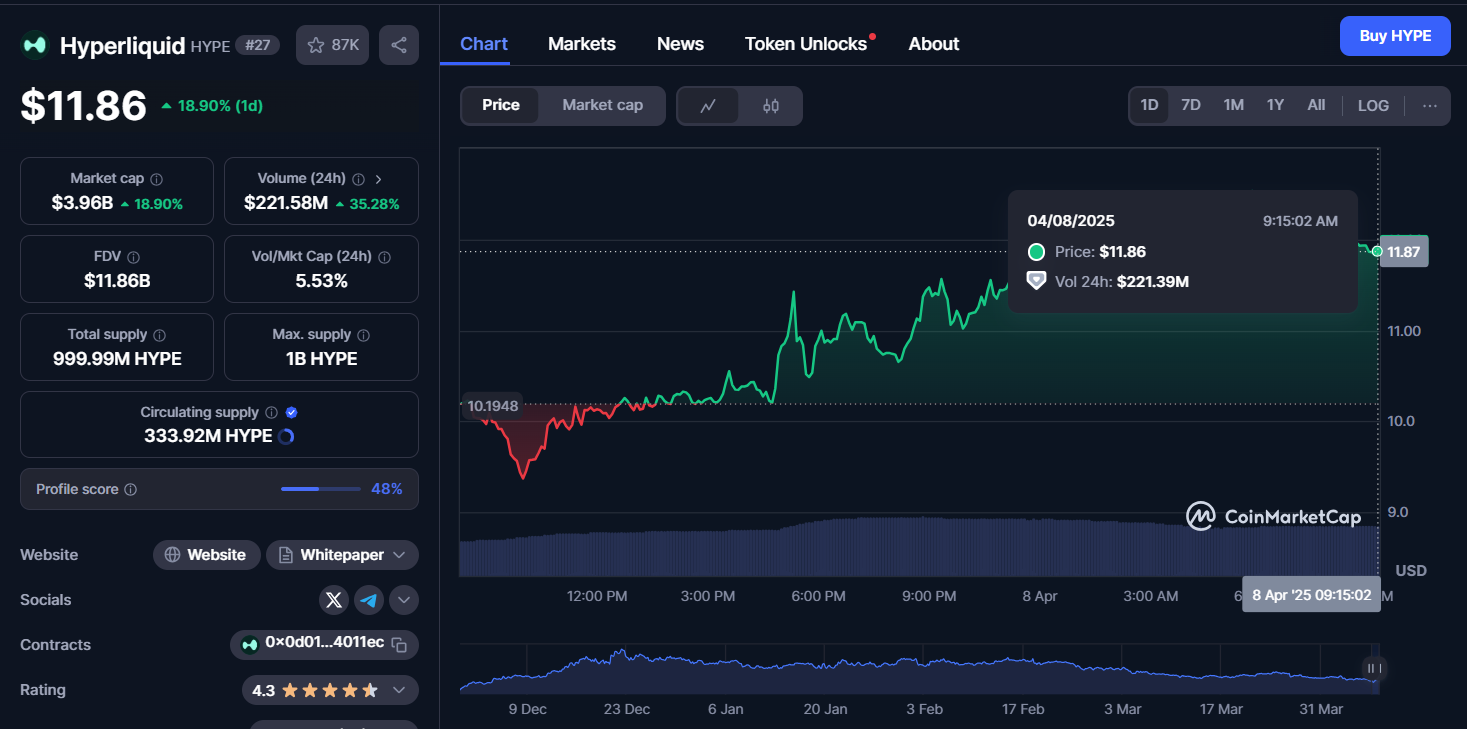
After a week of bearish trends in the crypto market, Hyperliquid, a Layer 1 blockchain designed to support on-chain financial applications, has taken a different path through its HYPE token. According to market updates, the digital asset has surged by over 25% in the last 24 hours, reaching an intraday high of $12.54 before slightly retracing to its current price of $11.89. Following the price surge, the market cap rose by 18.90%, reaching $3.96B, while trading volume increased by 35.28%, totaling $221.58M
 ***Source:***CoinMarketCapFurther, data that indicates HYPE’s open futures in the markets seems to be in a constant path. According to Coinglass data at the time of press, open interest started at approximately $448 million on February 15 and saw a decline until March 1
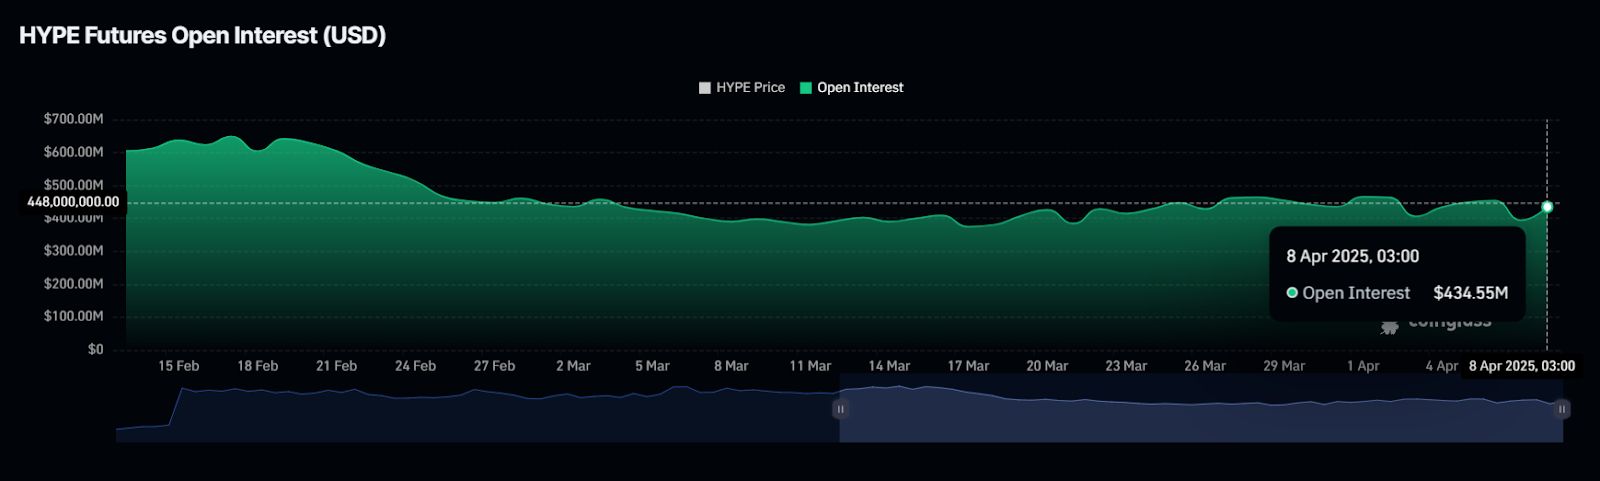 ***Source:***CoinglassOpen interest in the market displayed stable behavior starting from March 2 while experiencing slight growth. Open interest hit a peak of $434.55 million by April 8, 2025. HYPE price maintained steady movements with patterns that paralleled open interest trends throughout the period
Moving to the current technical indicators, the Relative Strength Index (RSI) for HYPE stands at 38.70, indicating that the token is approaching oversold territory. While an RSI below 30 typically signals an asset is oversold and may be due for a rebound, values between 30–50 still reflect bearish momentum but with potential for a reversal if buying pressure builds.
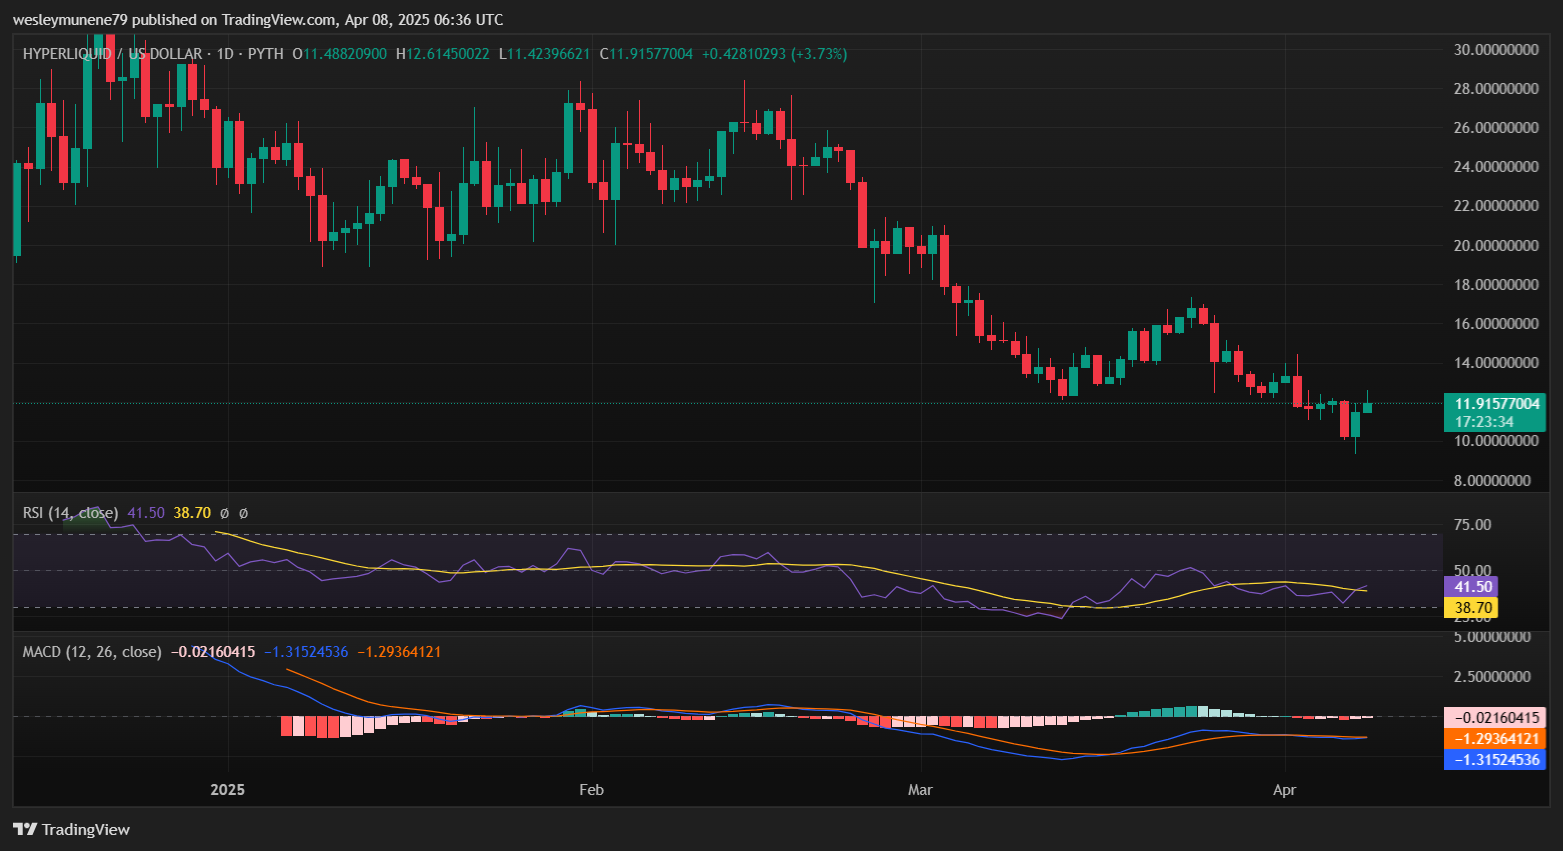 Source: TradingViewMeanwhile, the Moving Average Convergence Divergence (MACD) is another key tool for trend analysis. The MACD line is currently at -1.31591130, with the signal line at -1.29377440. The negative MACD value suggests bearish momentum, but the gap between the MACD line and the signal line has narrowed, which could indicate a weakening of downward pressure
The RSI and MACD indicators both suggest that the token may face a short-term consolidation phase. As the RSI approaches the oversold zone, it may reflect potential price movements, while the MACD shows a shift in bearish momentum.
In terms of key levels, $10.23 acts as a strong support, with a deeper support previously observed near $13.06, though the token is currently trading below that. On the upside, $15.00 is the immediate resistance, with $18.00 being the next major barrier. These support and resistance zones will be crucial in determining the token’s next move.
Highlighted Crypto News:
Chainlink Gains Over 11%, Can It Break Through the $15 Barrier?
Disclaimer: The information on this page may come from third parties and does not represent the views or opinions of Gate. The content displayed on this page is for reference only and does not constitute any financial, investment, or legal advice. Gate does not guarantee the accuracy or completeness of the information and shall not be liable for any losses arising from the use of this information. Virtual asset investments carry high risks and are subject to significant price volatility. You may lose all of your invested principal. Please fully understand the relevant risks and make prudent decisions based on your own financial situation and risk tolerance. For details, please refer to
Disclaimer.
