 The recent sell-off of Ethereum (ETH) has caused the price to lose the important support level of $1,500, and many technical indicators suggest that ETH may need to undergo a deeper correction before entering a sustainable recovery process.
Data shows that the price of ETH has fallen below its fair value — an on-chain indicator used to recalibrate the market value based on the last price at which each coin was moved on the blockchain.
According to an expert from CryptoQuant named theKriptolik, ETH trading below its fair price is a historically negative signal. When the fair price is higher than the market price, it often acts as a resistance level and puts “most holders in an immediate loss position,” the expert stated.
“A price drop below the reasonable price often marks the beginning of capitulation, when investors lose confidence and start to panic sell en masse.”
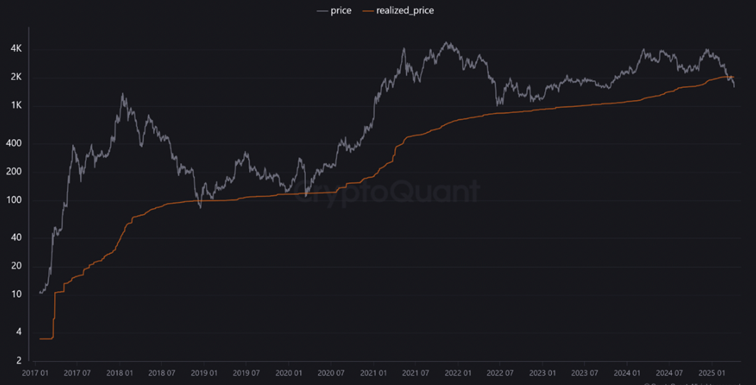 The fair value of ETH for accumulation addresses | Source: CryptoQuantIn June 2022, the fair value of ETH fell below the spot price, before the price of ETH dropped 51% after the market crash due to the Terra Luna event. A similar scenario occurred in November 2022, when this index fell below the market price just before ETH dropped 35% after the collapse of the FTX exchange.
Now, as a similar scenario unfolds, the current setup somewhat reflects the previous stages of a continuing downtrend, putting ETH at risk of a deeper correction.
The inflow of funds into Ethereum spot ETFs remains weak
Spot Ethereum ETFs continue to show signs of weakness, with a net outflow of more than $3.3 million on April 8 alone. In fact, over the past two weeks, these investment products have recorded a total net outflow of $94.1 million, while inflows have only reached about $13 million.
The lack of interest from investors is a worrying sign, especially when demand from institutions is seen as a key factor driving the appeal of ETH and has played an important role in the price increase in May 2024, when investors expected the ETF to be approved by the U.S. Securities and Exchange Commission (SEC).
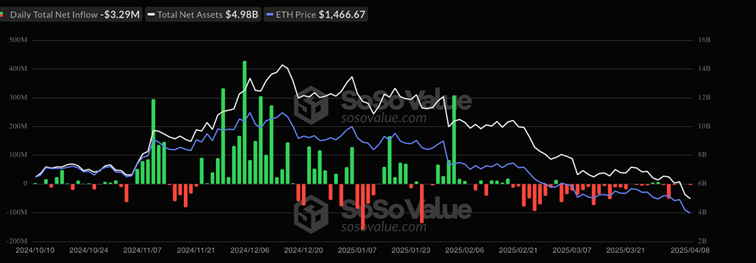 The flow through the Ethereum spot ETF | Source: Farside InvestorsThis is also reflected in all other ETH products, with a report from CoinShares indicating that the inflow into Ethereum investment funds aligns with the overall bearish sentiment in the market, with a net outflow of $37.4 million recorded in the week ending April 4.
Low OI ETH and negative funding rates
Another factor pulling ETH prices down is the bleak situation in the derivatives market, as reflected by the low open interest and negative funding rates.
Open interest (OI) — the total number of futures and options contracts outstanding — remains low, indicating a decrease in trader participation and speculative activity. Currently, open interest stands at $16.7 billion, down 48% from the peak of $32.3 billion on January 24.
A decline in OI indicates that investor confidence or interest is waning, which could lead to increased depreciation as buying pressure diminishes.
!()https://img.gateio.im/social/moments-36b9605c800f9d08bd1ea375fad168cc[eth]OI ETH on All Exchanges | Source: CoinGlassPlus, negative funding rates in ETH’s perpetual futures markets exacerbate this problem, as they are hovering below 0%, implying bearish sentiment prevails in the market.
When funding rates turn negative, it means that Short ( bets on a price decline) must pay Long to maintain their positions, indicating that bearish sentiment is prevailing.
!()https://img.gateio.im/social/moments-cc65d5c027f3e1d06ab1e356de38bb74[eth]Funding rates ETH on all exchanges | Source: Glassnode## Layer-1 blockchain competitors surpass the performance of the Ethereum network
The high gas fees of Ethereum create opportunities for rival layer-1 blockchains to focus on high scalability to capture Ethereum’s market share in this space. Although some activity has shifted to Ethereum’s layer-2 solutions, some users and developers opt for other top layer-1 alternatives such as BNB Chain, Solana, Avalanche, and Tron.
As a result, the growth rate of Ethereum’s network activity lags behind its competitors.
!()https://img.gateio.im/social/moments-93ae401c22198cea43a81ddcbaa6a157[eth]Ranking of top blockchains by volume DApp 24 hours (USD) | Source: DappRadarThe number of Ethereum’s (UAW) unique active wallets — addresses that participate in the decentralized application (DApp) on the platform —is down more than 33% over the past 30 days, compared to Solana’s decline of just 16% and Tron’s 16% gain.
Similarly, the total number of transactions on the Ethereum network decreased by 40.5% during the same period, while transactions on BNB Chain, Solana, and Avalanche decreased by 16%, 30%, and 23% respectively. Transactions on Tron and Fantom increased by 23% and 16% respectively.
There are no signs that the factors affecting the price of ETH — such as reduced network activity and low demand for spot Ethereum ETF products — will reverse in the near future.
Although this does not guarantee that ETH will continue its long-term downward trend, technical indicators suggest that the price may bottom out at $1,000.
Disclaimer: This article is for informational purposes only and is not investment advice. Investors should do thorough research before making decisions. We are not responsible for your investment decisions.
- Ethereum (ETH) surges strongly – Is the $1,850 mark the next target?
- SEC approves options trading for spot Ethereum ETFs
- The U.S. securities law is outdated in the era of digital assets, experts warn Congress.
Dinh Dinh
@media only screen and (min-width: 0px) and (min-height: 0px) {
div[id^=“wrapper-sevio-d89f58f5-7b63-40be-98c0-6b1fd62584fb”] {
width:320px;
height: 100px;
}
}
@media only screen and (min-width: 728px) and (min-height: 0px) {
div[id^=“wrapper-sevio-d89f58f5-7b63-40be-98c0-6b1fd62584fb”] {
width: 728px;
height: 90px;
}
}
Disclaimer: The information on this page may come from third parties and does not represent the views or opinions of Gate. The content displayed on this page is for reference only and does not constitute any financial, investment, or legal advice. Gate does not guarantee the accuracy or completeness of the information and shall not be liable for any losses arising from the use of this information. Virtual asset investments carry high risks and are subject to significant price volatility. You may lose all of your invested principal. Please fully understand the relevant risks and make prudent decisions based on your own financial situation and risk tolerance. For details, please refer to
Disclaimer.
