 The price chart of XRP has been in red over the last one week as the coin dips nearly 9% over the last 7 days. On the day, Ripple backed XRP is also facing bearish pressure as the price is down by 3%. This downward price movement comes even after increased institutional adoption
Several firms including Chinese AI firm Webus International and VivoPower have shown interest in XRP. But despite this, XRP has continued to face downside pressure. The coin risks plunging below $2 if the bearish momentum continues
XRP Faces Heightened Institutional Interest
Yesterday, reports emerged that Chinese AI firm Webus International is making preparations to purchase XRP. The firm is planning to raise up to $300 to purchase these coins for its strategic reserve. This move comes as part of the company’s strategy to create a crypto reserve for its borderless payments ambitions
On the same line, the firm plans to raise the capital to purchase the Ripple through various ways including bank loans, institutional credit lines, shareholder guarantees and some of its own reserves
“An XRP blockchain integration has the potential to revolutionize how we handle cross-border payments for both partners and travelers worldwide,” said Nan Zheng, Webus’ Chief Executive Officer
In yet another demand instance, VivoPower International (VVPR) confirmed last Wednesday that it was making plans to invest in XRP. The Nasdaq-listed energy company entered an agreement to use a $121 million private share placement to fund its creation of a digital asset treasury with Ripple as the focus crypto
DMI Signals Bearish Trend for XRP
Despite the growing interest from institutions, Ripple is facing heightened bearish pressure. In particular, the Directional Movement Index (DMI) of XRP shows a shift in the trend and strength. The directional indicator +D, for instance, has dipped to 13.61. On the other hand, it has surged to 27.25 on the daily chart
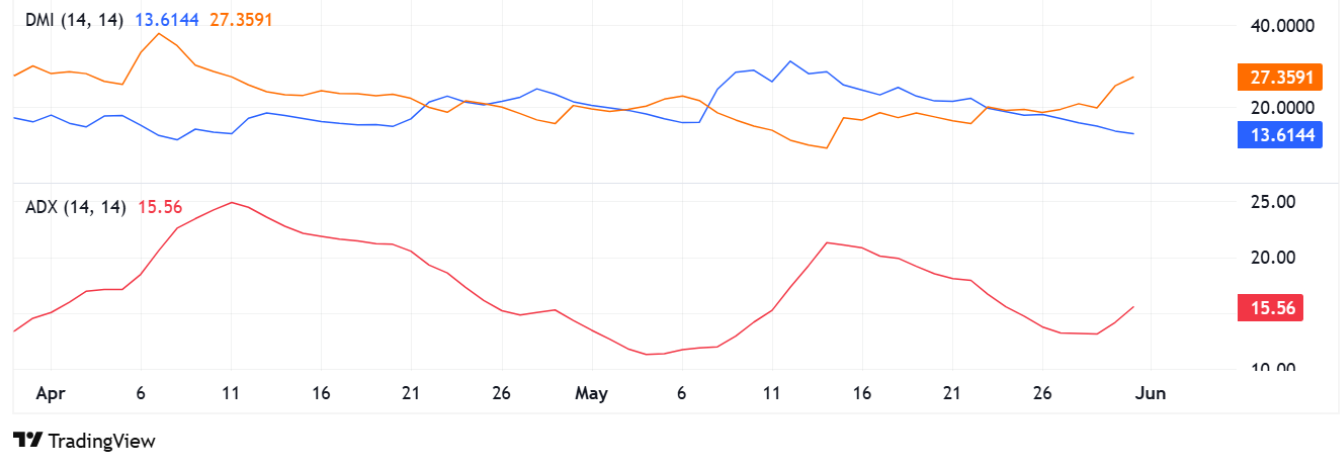 DMI of XRP | Source: TradingViewWith the two directional indicators moving in opposite directions, this shows a growing gap between the two. The widening of the gap usually signals a growing bearish trend. A dip in the +D directional indicator shows that XRP’s bullish momentum is fading. In the same manner, the rising -D directional indicator shows that bearish momentum is picking up pace
But despite the directional indicators pointing towards rising bearish momentum, THE Average Directional Index (ADX) is giving a spark of hope. The ADX usually shows the strength of the prevalent trend. For the case of Ripple, the ADX has a reading of 15.56 showing weakness in the current trend
Normally, an ADX reading of 25 and above shows a stronger trend in spite of whether the trend is bullish or bearish. A reading below 25 highlights a trend in the market
XRP’s RSI is Bearish – But Which Are the Key Price levels?
As per the daily chart on TradingView, XRP is currently trading at $2.1304 as at press time. The coin is on a four day streak in red, meaning that the price is plunging. To get a better look, let’s look at the RSI
The RSI of XRP is currently sitting at 37.32, dropping from 49.98 recorded yesterday. This dip in the RSI confirms the struggles that the coin is currently facing as sellers take control of the moment. If buyers fail to step up, XRP could plunge further before the RSI hits the oversold level
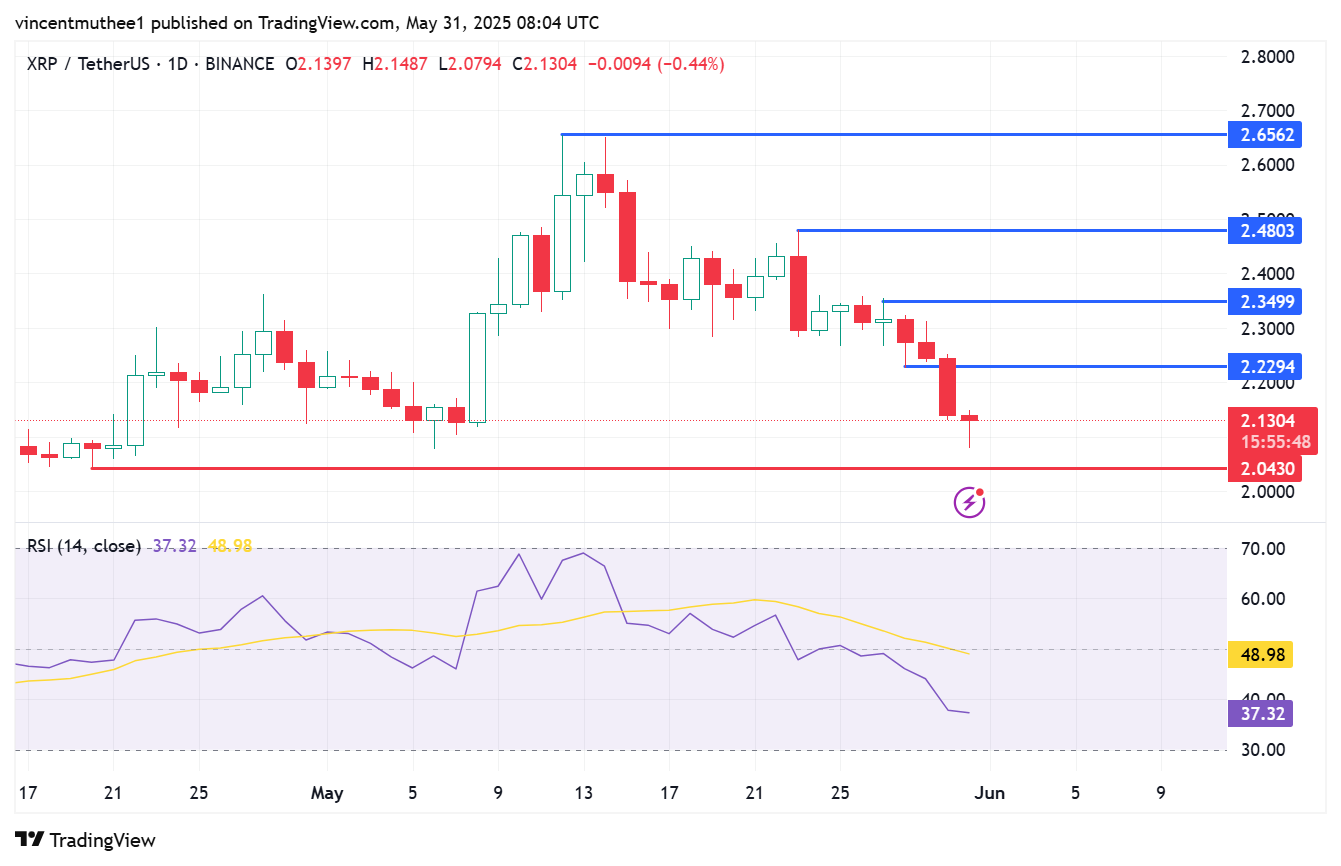 XRP’s RSI and Key Price Levels | Source: TradingViewBut as XRP dips, which are the key price levels to keep an eye on?
Trading at $2.1304 and clearly set to plunge as per the technical indicators, XRP risks losing $2.0 level. The immediate support lies at $2.0430. If the coin breaches this support, investors could encounter huge losses as panic-selling kicks in
However, if bulls manage to step up, Ripple could reverse the bearish trend. The coin faces resistance at $2.2294. Surging past this level is crucial to spark a rally to the resistance at $2.3499 or even higher. Climbing past key resistance XRP is crucial for XRP to regain bullish momentum
Disclaimer: The information on this page may come from third parties and does not represent the views or opinions of Gate. The content displayed on this page is for reference only and does not constitute any financial, investment, or legal advice. Gate does not guarantee the accuracy or completeness of the information and shall not be liable for any losses arising from the use of this information. Virtual asset investments carry high risks and are subject to significant price volatility. You may lose all of your invested principal. Please fully understand the relevant risks and make prudent decisions based on your own financial situation and risk tolerance. For details, please refer to
Disclaimer.
