Date: Thu, Dec 18, 2025 | 08:50 AM GMT
The broader cryptocurrency market has been experiencing choppy price action over the past several weeks, a phase that began after the sharp sell-off on October 10. That correction dragged** Ethereum (ETH) **down by nearly 22% over the last 60 days, keeping sustained pressure on major altcoins, including Polygon (POL).
POL has dropped more than 10% over the past week and is now down over 43% across the last 60 days. While the short-term trend remains clearly bearish, the higher-timeframe chart is beginning to reveal a technical structure that could be setting the stage for a potential rebound if key levels are reclaimed.
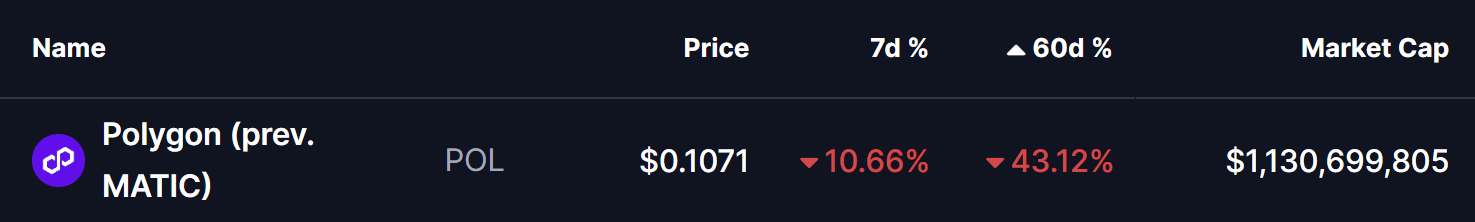
Source: Coinmarketcap
Power of 3 Pattern in Play?
On the weekly chart, POL appears to be forming a classic Power of 3 structure, a pattern often associated with market cycle lows and trend transitions. This setup typically unfolds in three phases — accumulation, manipulation, and expansion — with the most volatile move emerging once the final stage begins.
Accumulation Phase
Earlier in the year, POL spent an extended period consolidating within a well-defined range, capped by resistance near the $0.27 region and supported around the $0.15 zone. This sideways movement reflected an accumulation phase, where volatility compressed and price action became increasingly muted. Such conditions often suggest quiet positioning by larger market participants while broader interest fades and sentiment turns neutral to bearish.
This range-bound behavior laid the groundwork for the next phase of the structure, as liquidity built up on both sides of the market.
Manipulation Phase
During the latest market-wide downturn, POL broke decisively below the $0.15 accumulation support, sliding to a recent low near $0.107. This sharp breakdown, highlighted by the red-shaded area on the chart, aligns closely with the manipulation phase of the Power of 3 pattern. Moves like this are typically designed to trigger stop losses, force capitulation among weaker holders, and push sentiment to pessimistic extremes.
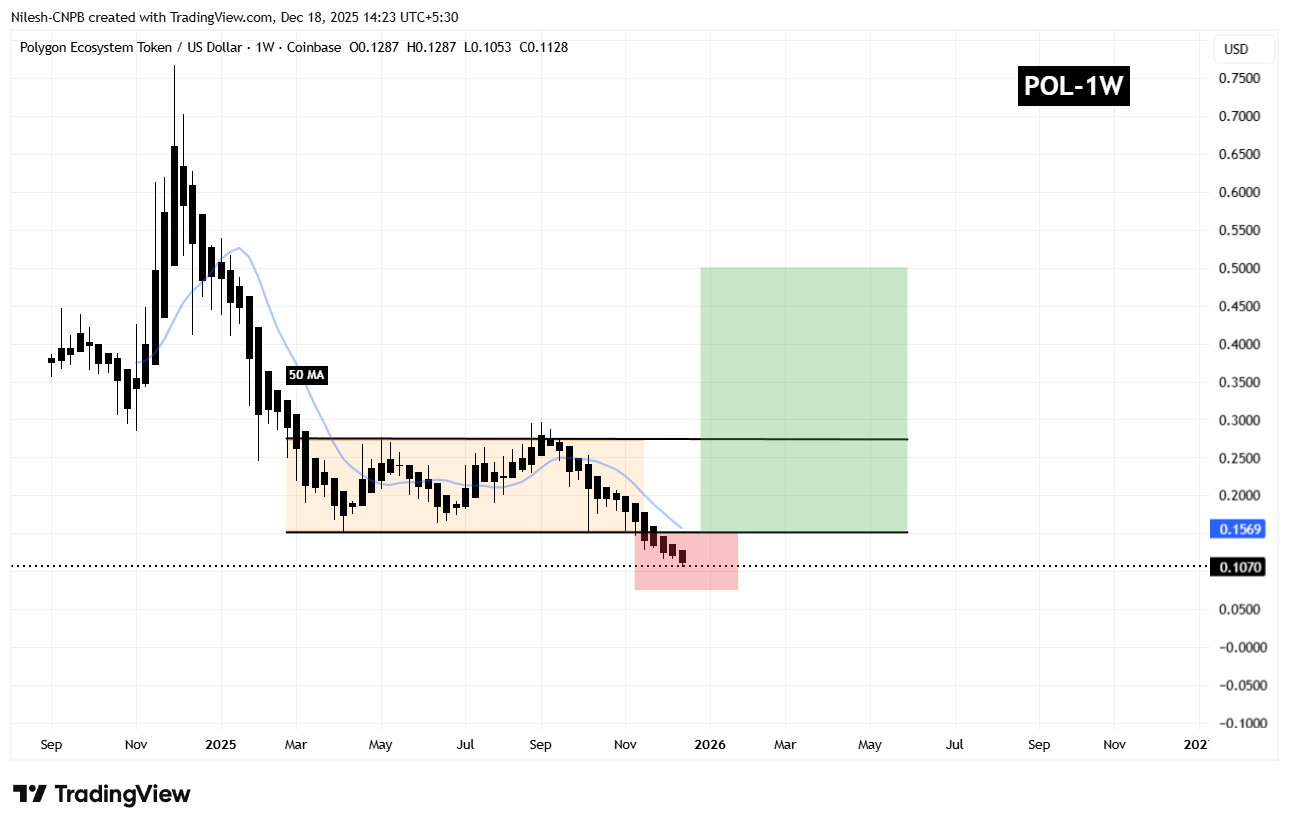
Polygon (POL) Weekly Chart/Coinsprobe (Source: Tradingview)
Notably, the selling pressure has started to lose momentum near this lower zone. Candles are compressing, and downside follow-through appears limited, suggesting that aggressive distribution may be nearing exhaustion.
What’s Next for POL?
At present, POL remains within this manipulation zone, indicating that the market is still probing for direction before committing to a larger move. A brief period of consolidation around current levels would not be unusual, as buyers and sellers continue to battle for control.
For the bullish scenario to gain traction, POL needs to reclaim the $0.15 support zone and move back above the 50-week moving average near $0.1569. A successful recovery above these levels would signal a transition into the expansion phase of the Power of 3 structure, where upside momentum typically accelerates quickly.
If that breakout materializes, the chart projection points toward a potential move into the $0.48–$0.50 region over the coming months, an area that aligns with prior structural resistance.
However, this setup remains conditional. As long as POL continues to trade below $0.15, downside risks cannot be ruled out, and the market remains vulnerable to further volatility. Holding current lows and reclaiming key resistance levels will be critical for bulls to validate the bullish reversal narrative.
Disclaimer: The views and analysis presented in this article are for informational purposes only and reflect the author’s perspective, not financial advice. Technical patterns and indicators discussed are subject to market volatility and may or may not yield the anticipated results. Investors are advised to exercise caution, conduct independent research, and make decisions aligned with their individual risk tolerance.
Disclaimer: The information on this page may come from third parties and does not represent the views or opinions of Gate. The content displayed on this page is for reference only and does not constitute any financial, investment, or legal advice. Gate does not guarantee the accuracy or completeness of the information and shall not be liable for any losses arising from the use of this information. Virtual asset investments carry high risks and are subject to significant price volatility. You may lose all of your invested principal. Please fully understand the relevant risks and make prudent decisions based on your own financial situation and risk tolerance. For details, please refer to
Disclaimer.
Related Articles
Bittensor TAO Jumps 17% as Market Momentum Strengthens
Key Insights:
Bittensor surged 17% in one day, with strong weekly and monthly gains supported by broader crypto stability and rising investor participation.
Institutional access expanded through new exchange products while Grayscale’s trust premium signaled sustained demand for
CryptoNewsLand17m ago
XRP Faces Pressure as Network Usage and Momentum Decline
Key Insights
XRP Ledger transactions and active accounts dropped sharply, signaling reduced usage and weakening demand that directly impacts the asset’s broader market outlook.
Price continues to face resistance at key technical levels, while compression below moving averages reflects
CryptoNewsLand26m ago
Ethereum Whales Buy the Dip, Eyes on $1,900
_ETH whales log second-largest accumulation inflow this cycle as traders call weekend chop near $2,000 before a potential $1,900 dip next week._
Ethereum is sitting near the $2,000 mark. Whales are not waiting. On-chain data shows large holders ramping up ETH purchases at a rate unseen since the cu
LiveBTCNews28m ago
XRP Sees 233% Spot Flow Surge Amid Rising Trading Activity
Key Insights:
XRP spot flows jumped 233% in one hour, highlighting increased direct market participation and signaling heightened short-term trading momentum across exchanges.
Price structure mixed signals: XRP forms higher lows while remaining below major averages, indicating easing
CryptoFrontNews52m ago
Cardano Drops to #12 But Here’s Why ADA Holders Shouldn’t Panic
Cardano just dropped to number 12 by market cap. And that stings, especially, if you’ve been holding through the highs and sitting through the lows. You start second-guessing yourself. Did I miss something, or does the market know something I don’t? Is the thesis even still valid?
But here’s t
CaptainAltcoin58m ago
Ondo Gains After Franklin Templeton ETF Tokenization Deal
Key Insights
Ondo gained eight percent after partnering with Franklin Templeton, boosting visibility and signaling deeper integration between traditional finance and blockchain-based investment products globally.
Tokenized ETFs will enable round-the-clock trading through crypto wallets,
CryptoNewsLand1h ago
