Date: Fri, Dec 19 2025 | 12:15 PM GMT
The broader cryptocurrency market has been showing relative strength despite concerns around the Japan rate hike, while easing U.S. inflation has helped both Bitcoin (BTC) and Ethereum (ETH) remain in the green. Against this backdrop, Bitcoin Cash (BCH) has quietly moved into the spotlight, posting a notable upside move.
BCH has climbed nearly 9% recently, but the bigger story appears to be unfolding on the chart itself. Price action is now forming a structure that often precedes larger trend reversals, suggesting that the recent rally may be more than just a short-term bounce.
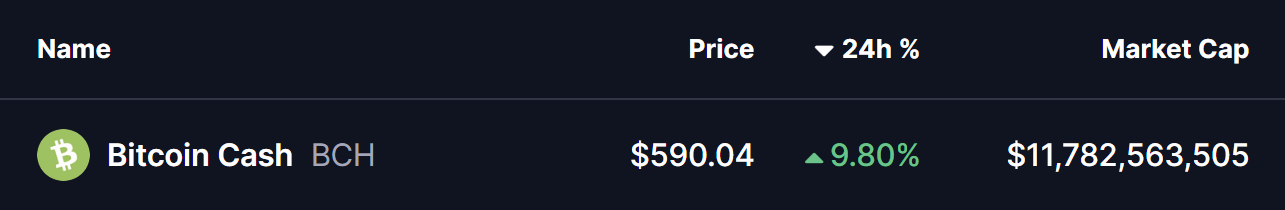
Source: Coinmarketcap
Rounding Bottom in Play?
On the daily timeframe, Bitcoin Cash appears to be carving out a rounding bottom formation — a classic bullish reversal pattern that reflects a gradual shift from distribution to accumulation. This pattern typically develops after a prolonged correction, as selling pressure fades and buyers slowly regain control.
The setup began after BCH faced a firm rejection near the $630 region in September 2025. That rejection triggered a sharp decline, dragging price down toward the $446.9 area. Importantly, sellers failed to push price significantly lower from there, and strong demand emerged at those levels. Over time, BCH stabilized, volatility compressed, and price began to curl higher, completing the rounded base structure.
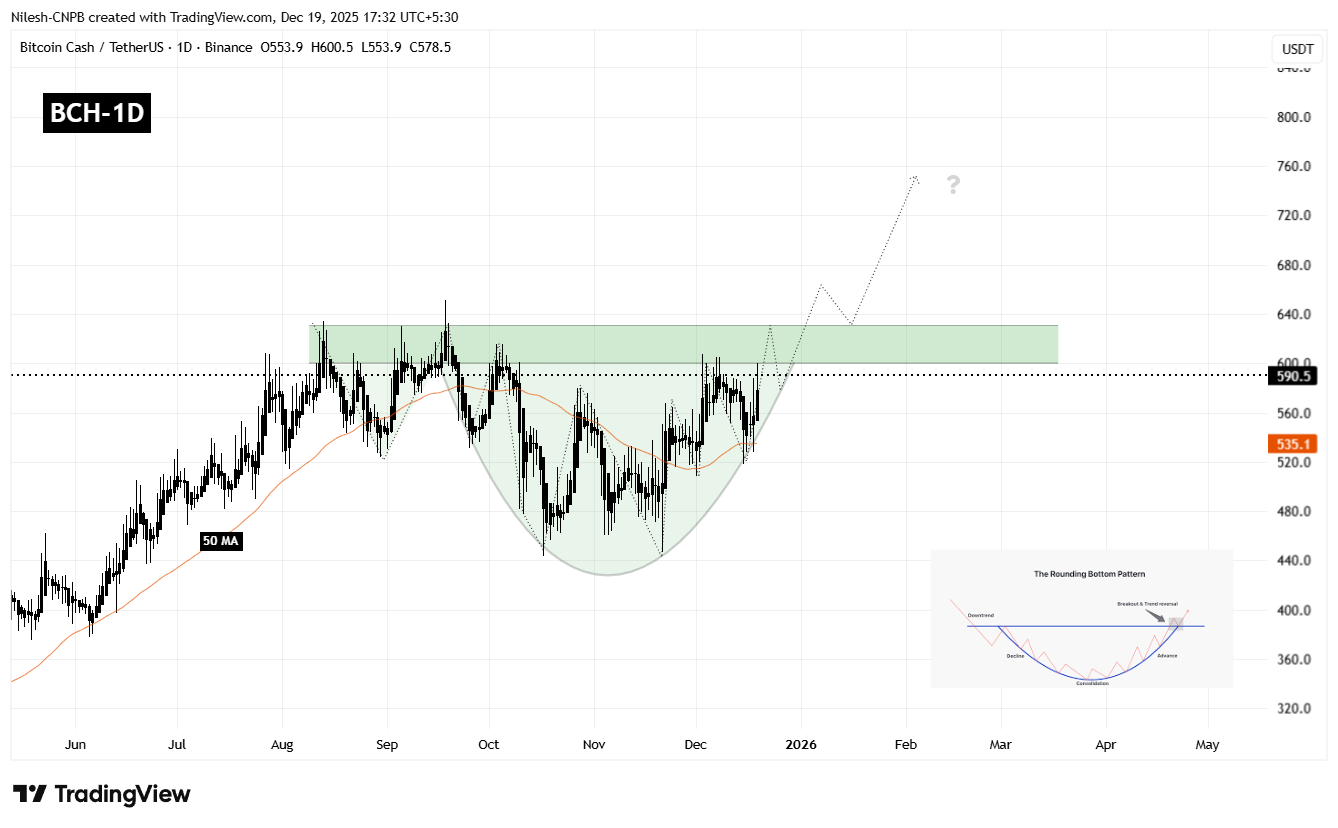
Bitcoin Cash (BCH) Daily Chart/Coinsprobe (Source: Tradingview)
Currently, BCH is trading around the $590 mark and pressing up against a well-defined resistance zone between $600 and $630. This area represents the neckline of the rounding bottom pattern and has capped price advances multiple times in the past, making it the most critical level to watch in the near term.
What’s Next for BCH?
A clean daily close above the $600–$630 resistance zone would confirm the bullish rounding bottom breakout. If that breakout is followed by a successful retest of the same zone as support, it would significantly strengthen the bullish case and suggest that a new upward leg is underway.
Based on the depth of the rounding structure, the projected upside target points toward the $800–$820 region. Reaching that zone would imply a potential upside of roughly 35–40% from current levels, aligning with the measured move typically associated with this pattern.
However, patience remains important. Before any confirmed breakout, BCH could still experience short-term pullbacks, including a dip toward the rising base of the rounding structure or the 50-day moving average, which has been acting as dynamic support during the recovery. Such pullbacks would not necessarily invalidate the bullish setup, as long as price continues to hold above the higher low structure.
Until a decisive breakout and retest occur, traders may want to remain cautious and avoid chasing price. The $600–$630 zone remains the line in the sand that will determine whether BCH transitions into a sustained bullish phase or remains range-bound for longer.
Disclaimer: The views and analysis presented in this article are for informational purposes only and reflect the author’s perspective, not financial advice. Technical patterns and indicators discussed are subject to market volatility and may or may not yield the anticipated results. Investors are advised to exercise caution, conduct independent research, and make decisions aligned with their individual risk tolerance.
Disclaimer: The information on this page may come from third parties and does not represent the views or opinions of Gate. The content displayed on this page is for reference only and does not constitute any financial, investment, or legal advice. Gate does not guarantee the accuracy or completeness of the information and shall not be liable for any losses arising from the use of this information. Virtual asset investments carry high risks and are subject to significant price volatility. You may lose all of your invested principal. Please fully understand the relevant risks and make prudent decisions based on your own financial situation and risk tolerance. For details, please refer to
Disclaimer.
Related Articles
Bitcoin Breaks $72K as $280M Bear Liquidations Test Fragile Truce
Bitcoin extended a sharp intraday move higher on Tuesday, rising about 6% within four hours as risk appetite improved in tandem with a broader rally in global equities after news of a two-week ceasefire between the United States and Iran. The swift price surge coincided with a wave of liquidations i
CryptoBreaking26m ago
BTC drops 0.62% over 15 minutes: exchange net inflows intensify and short-term arbitrage converges to trigger volatility
From 18:00 to 18:15 on April 9, 2026 (UTC), the BTC price return recorded -0.62%, closing in the range of 71857.8 to 72375.1 USDT, with a trading range of 0.72%. Market attention was notably elevated, volatility intensified, and capital moved quickly within a short period. Overall market sentiment has become more cautious, and investors’ willingness to trade in the short term has increased.
The main driving force behind this abnormal move is an increase in net inflows to BTC exchanges during the anomaly window; the 10-minute net flow reached 755.92 BTC, indicating that some investors chose to transfer funds to exchanges to seek arbitrage opportunities in the midst of the volatility issue
GateNews1h ago
BTC 15-minute pump 0.55%: Large on-chain funds inflows and options positioning resonate to lift spot prices
2026-04-09 17:00 to 2026-04-09 17:15 (UTC), the BTC spot market saw a rapid spike with a +0.55% return. The price range was 72,063.9 to 72,518.5 USDT, and the full-period amplitude reached 0.63%. This upswing coincided with rising market attention; volatility clearly intensified, drawing funds into short-term trading in a mix of cautious sentiment and localized increased volume.
The main driving force behind this move was concentrated inflows to exchanges from on-chain large transfers, which pushed up spot market buy orders in a short time. Data shows that, in the past 24 hours, on-chain BTC transfers
GateNews2h ago
Mainstream CEX and DEX funding-rate displays suggest an increasingly bearish market sentiment
On April 10, the Bitcoin price broke through $72k again. According to Coinglass data, the funding rates on major trading platforms show that the market’s bearish sentiment is strengthening. Funding rates are used to balance the contract price with the asset price; a rate below 0.005% indicates that the market is broadly bearish.
GateNews3h ago
Over the past 1 hour, forced liquidations across the entire market totaled $101 million, including $80.39 million in BTC liquidations.
Gate News message, on April 9, CoinGlass data shows that over the past 1 hour, liquidations across the entire network totaled $101 million, including $97.07 million from short liquidations and $3.54 million from long liquidations. In addition, the liquidation amount for BTC reached $80.39 million, while the liquidation amount for ETH reached $11.79 million.
GateNews3h ago
