 The Aptos (APT) price has moved up fast, but that move is slowing down. After hitting recent highs, price has slowed down. It is still moving up, but buyers are no longer pushing as hard near the top.
A short dip often happens before the market decides what to do next. A short dip would not be unusual, even if the overall trend stays positive.
This does not mean the trend is broken. It does mean the market is reaching a point where a pause or pullback would be normal.
_Read Also: _****Solana (SOL) Pays $1.4B a Year – So Why Are Validators Quitting?
What the APT Chart Is Showing Right Now
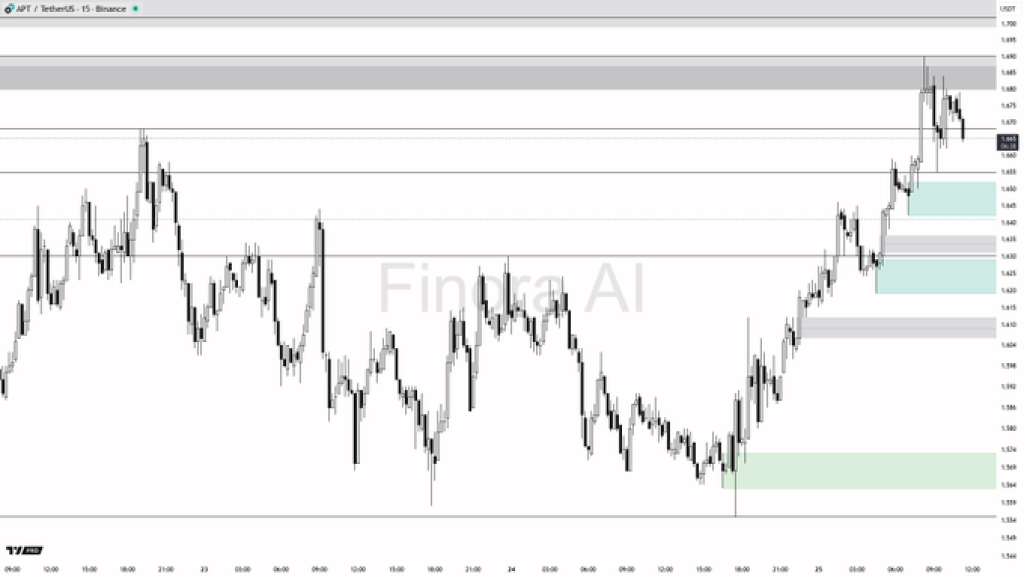
On the 15m chart, the APT price remains in an uptrend with higher highs and higher lows. However, price is now stalling just below the most recent swing high. This is often where early buyers start taking profits, especially after a fast move up.
There is also a nearby imbalance below current price. It is common for markets to revisit these regions before determining the next course of action. That said, even if the broader structure remains bullish, a short-term dip into the region would not be an element of surprise.
_Read Also: _****Why Banks Still Can’t Hold XRP, and What Could Change That
The Aptos (APT) price has moved up fast, but that move is slowing down. After hitting recent highs, price has slowed down. It is still moving up, but buyers are no longer pushing as hard near the top.
A short dip often happens before the market decides what to do next. A short dip would not be unusual, even if the overall trend stays positive.
This does not mean the trend is broken. It does mean the market is reaching a point where a pause or pullback would be normal.
_Read Also: _****Solana (SOL) Pays $1.4B a Year – So Why Are Validators Quitting?
What the APT Chart Is Showing Right Now
On the 15m chart, the APT price remains in an uptrend with higher highs and higher lows. However, price is now stalling just below the most recent swing high. This is often where early buyers start taking profits, especially after a fast move up.
There is also a nearby imbalance below current price. It is common for markets to revisit these regions before determining the next course of action. That said, even if the broader structure remains bullish, a short-term dip into the region would not be an element of surprise.
_Read Also: _****Why Banks Still Can’t Hold XRP, and What Could Change That
Source: X/FinoraAI
The main demand zone sits between $1.646 and $1.630. This area lines up with previous reactions and unfilled liquidity. A controlled pullback into this zone would still fit a bullish continuation setup.
If price drops into this zone and buyers show up, APT could move higher again. A quick bounce from this area would be the first sign.
The next levels to watch are around $1.688 and $1.702. If price falls below $1.619, this bullish setup no longer holds.
A clear breach below that threshold would affirm sellers are in charge, thereby opening the floodgates for a further decline toward $1.590 or even $1.568.
_Read Also: _****Pump.fun Was Solana’s Top Cash Machine, But PUMP Token Is Down 80%
Short-Term Outlook for APT
Right now, Aptos is not showing panic or heavy selling. It is showing hesitation. That usually comes before either a reset lower or another leg up.
As long as the Aptos price holds above the $1.630 area, the trend remains intact. A pullback into demand could offer a healthier structure for continuation. If that support fails, the chart shifts from pullback to breakdown.
For now, APT is at a decision point. The next reaction around support will likely decide whether this move continues or takes a deeper pause.
Disclaimer: The information on this page may come from third parties and does not represent the views or opinions of Gate. The content displayed on this page is for reference only and does not constitute any financial, investment, or legal advice. Gate does not guarantee the accuracy or completeness of the information and shall not be liable for any losses arising from the use of this information. Virtual asset investments carry high risks and are subject to significant price volatility. You may lose all of your invested principal. Please fully understand the relevant risks and make prudent decisions based on your own financial situation and risk tolerance. For details, please refer to
Disclaimer.
Related Articles
On-Chain Analyst ZachXBT Flags 6 Altcoins for Suspicious Price Manipulation
On-chain analyst ZachXBT flagged six altcoins (SIREN, MYX, COAI, M, PIPPIN, RIVER) for suspicious price movements akin to the RAVE token case, urging exchanges to act swiftly against market manipulation to protect retail investors.
GateNews2m ago
BTC falls 0.44% in 15 minutes: ETF fund outflows and derivatives shorts add to the slide
From 21:45 to 22:00 (UTC) on April 19, 2026, the BTC price dropped by 0.44% within 15 minutes. The candlestick range was 74,366.1 to 74,789.3 USDT, with an amplitude of 0.57%. Short-term volatility was concentrated. During this period, the trading volume for large orders rose significantly, market attention increased, and volatility intensified.
The main driving force behind this deviation was that U.S. spot Bitcoin ETFs saw a large net outflow of $291 million over two days from April 18 to April 19. This reflected institutional funds pulling away in the short term, which led to a marked increase in sell pressure in the spot market. At the same time, BTC perpetual contract
GateNews21m ago
Dogecoin Holds $0.094 as X Cashtags Drive Market Attention
Key Insights
Dogecoin holds above $0.094 despite market weakness as Bitcoin and Ethereum stabilize, reflecting resilience and sustained demand across major cryptocurrencies during the consolidation phase.
X launches smart cashtags enabling real-time crypto and stock tracking, improving marke
CryptoNewsLand2h ago
Dogecoin Holds $0.09 Support as $0.10 Breakout Looms
Dogecoin remains around $0.09, showing limited movement as traders await a clear breakout direction. Key support is at $0.08, with resistance at $0.10. Current technical indicators suggest a balanced market, but a decisive move is needed to shift momentum.
CryptoNewsLand3h ago
XRP Price Clears $1.40 While Broader Downtrend Persists
XRP's recent rise above $1.40 indicates a shift in market behavior after a consolidation phase. While momentum indicators show improvement, the broader bearish trend persists, limiting upside potential. Sustained support is crucial for extending its recovery.
CryptoNewsLand3h ago
Chainlink Price Compresses Below $10 as Breakout Pressure Builds
Key Insights
Chainlink maintains higher lows within a tightening range, reflecting steady accumulation as buyers absorb selling pressure and prepare for a potential breakout move
Repeated resistance tests near $10 weaken supply levels while rising support strengthens demand, increasing the p
CryptoNewsLand3h ago
