
Date: Mon, Dec 29, 2025 | 08:30 AM GMT
The broader cryptocurrency market has kicked off the final week of 2025 on a constructive note, with both Bitcoin (BTC) and Ethereum (ETH) posting gains of over 2%. This steady strength among major assets has helped stabilize market sentiment, creating room for select altcoins — including Sui (SUI) — to develop promising technical structures.
SUI is trading with a modest intraday gain, but more importantly, its price action is beginning to reflect a clear structural shift. The chart suggests that selling pressure is fading and that a potential bullish continuation phase may be forming beneath the surface.
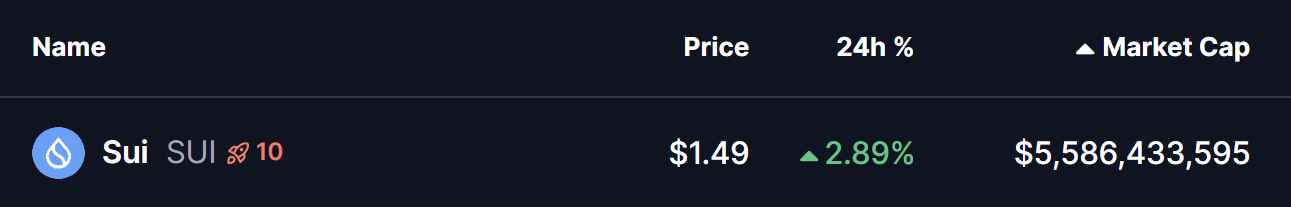
Source: Coinmarketcap
Bearish Bat Pattern in Play?
On the 4-hour timeframe, SUI appears to be carving out a Bearish Bat harmonic pattern. Despite its name, this structure often allows for an upside move toward the completion point before any broader trend decision takes place.
The formation started from Point X near the $1.728 area, followed by a sharp decline into Point A. Price then staged a recovery toward Point B before undergoing a deeper corrective move into Point C around $1.35. This region acted as a strong demand zone, where buyers consistently stepped in to absorb selling pressure.
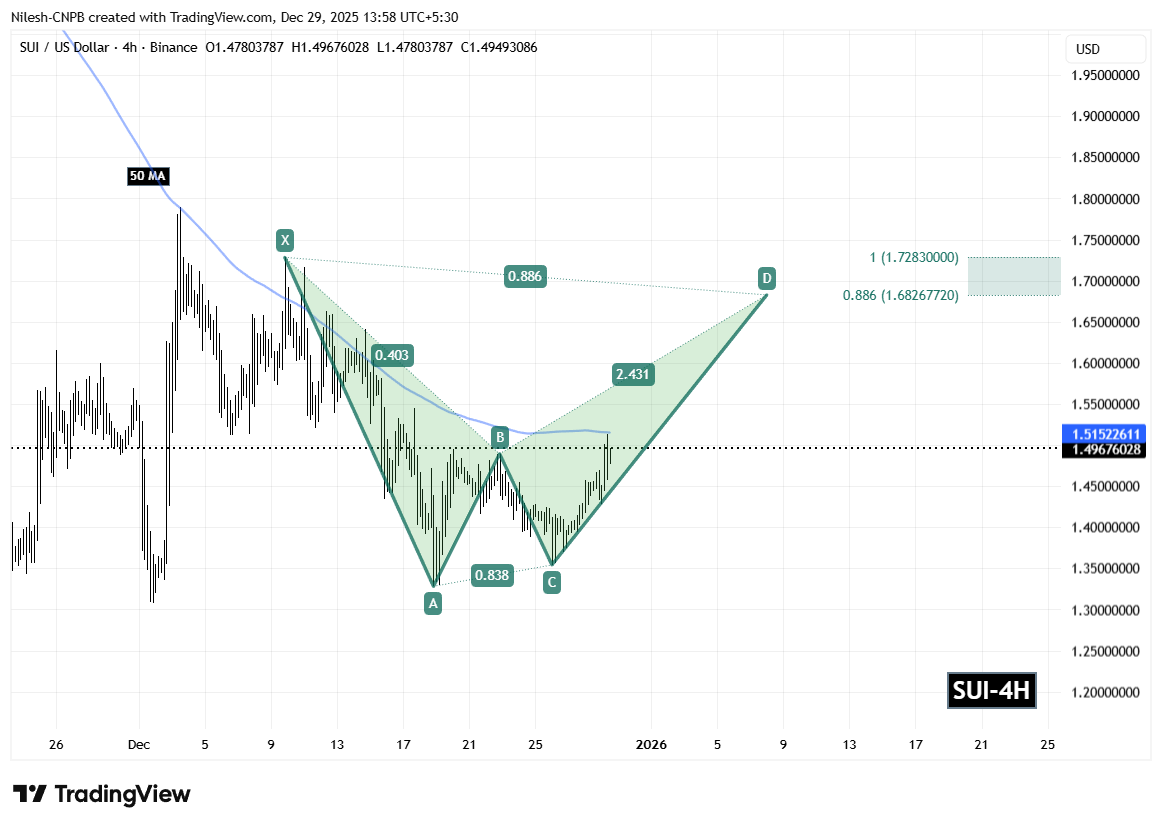
Sui (SUI) 4H Chart/Coinsprobe (Source: Tradingview)
Since printing the Point C low, SUI has shown steady recovery behavior and is currently trading around the $1.49 level. This rebound highlights waning bearish momentum and growing buyer confidence at lower prices.
Adding further technical weight to the setup, the 50-period moving average on the 4-hour chart is positioned near $1.51. A decisive reclaim and sustained hold above this level would reinforce bullish momentum and validate the ongoing recovery structure.
What’s Next for SUI?
If buyers continue to defend the $1.43 support zone and successfully flip the 50-hour moving average into support, the harmonic structure suggests a continuation move toward the Potential Reversal Zone (PRZ).
Based on Fibonacci projections, the PRZ lies between $1.6826 (0.886 extension) and $1.7283 (1.0 extension). This zone represents a potential upside of roughly 15% from current levels and aligns closely with classic harmonic completion targets, where price reactions often intensify.
For now, SUI’s technical outlook remains constructive. As long as support holds and momentum continues to build, the harmonic pattern indicates that the next meaningful move may favor the upside, positioning SUI for a test of higher resistance zones in the sessions ahead.
Disclaimer: The views and analysis presented in this article are for informational purposes only and reflect the author’s perspective, not financial advice. Technical patterns and indicators discussed are subject to market volatility and may or may not yield the anticipated results. Investors are advised to exercise caution, conduct independent research, and make decisions aligned with their individual risk tolerance.
About Author: Nilesh Hembade is the Founder and Lead Author of Coinsprobe, with over 5 years of experience in the cryptocurrency and blockchain industry. Since launching Coinsprobe in 2023, he has been providing daily, research-driven insights through in-depth market analysis, on-chain data, and technical research.

Disclaimer: The information on this page may come from third parties and does not represent the views or opinions of Gate. The content displayed on this page is for reference only and does not constitute any financial, investment, or legal advice. Gate does not guarantee the accuracy or completeness of the information and shall not be liable for any losses arising from the use of this information. Virtual asset investments carry high risks and are subject to significant price volatility. You may lose all of your invested principal. Please fully understand the relevant risks and make prudent decisions based on your own financial situation and risk tolerance. For details, please refer to
Disclaimer.
Related Articles
ETH 15-minute drop of 0.66%: short-term holders selling off in tandem with exchange net inflows amplifies the selling pressure
2026-04-12 22:00 to 22:15 (UTC), ETH showed a clear downward move in a highly liquid environment. The candlestick chart indicates a return of -0.66%, with price fluctuations ranging from 2186.76 to 2211.25 USDT, and a swing amplitude of 1.11%. Market attention rose rapidly, short-term sentiment turned cautious, and volatility intensified.
The main driving factors behind this unusual move are a sharp increase in exchange net inflows and concentrated selling by short-term holders. On-chain data shows that over the past 24 hours, net inflow of ETH into exchanges totaled 9,567.65 ETH, suggesting that a large amount of capital entered the market in the short term, potentially increasing selling pressure.
GateNews1h ago
CTSI Price Soars 17.57%: Institutional Interest Ramps Up
Amid a crypto market downturn, CTSI surged 17.57% to $0.03626 in an hour, driven by high trading volume and institutional interest in altcoins. Traders are now watching key support and resistance levels for future price movements.
Coinfomania3h ago
Bitcoin falls below 71,500 USD, U.S.-Iran talks remain deadlocked, and the Strait of Hormuz becomes the biggest point of contention
On April 11, the U.S. and Iran began 20 hours of negotiations in Pakistan. The core issue was freedom of passage through the Strait of Hormuz. After Bitcoin briefly rose to $73,800, it quickly fell back to $71,557. The U.S. side took a hardline stance, demanding that Iran open the strait, while Iran insisted that easing restrictions must wait until a comprehensive agreement is reached. The two sides have not yet reached a consensus.
動區BlockTempo7h ago
Crypto Market Maintains Steady Growth Trajectory As Top Assets Show Gains
The crypto market continues to grow, with a market cap of $2.44T and Bitcoin and Ethereum showing slight increases. Top gainers include $GPM and $BASE. Meanwhile, DeFi TVL declined, NFT sales rose, and notable developments include a trader's significant loss and a push for regulatory clarity in Congress.
BlockChainReporter8h ago
BTC 15-minute chart slightly down 0.57%: leveraged long positions passively cut risk and macro sentiment disturbances drive volatility
2026-04-12 12:45 to 13:00 (UTC), the BTC price range was 71081.7 to 71493.2 USDT, with an amplitude of 0.58%. Within 15 minutes, the return recorded was -0.57%. During the period of unusual activity, market volatility increased somewhat, risk sentiment warmed up, and overall attention rose; however, there was no extreme surge in volume or a sudden drop in liquidity.
The main driver behind this unusual activity is that, under the leverage structure, long positions were reduced passively. Recently, the funding rate for perpetual contracts turned from negative to positive. Leverage among longs in the market accumulated; the price dipped slightly, triggering liquidations of some leveraged long positions and sell orders for position closures, resulting in
GateNews10h ago
Analyst: Bitcoin’s current pullback is relatively mild compared with past ones, but the bottom has not been confirmed yet.
Crypto analyst Axel Adler Jr said the current Bitcoin pullback is smaller than historic bearish-market levels, but a bottom has not yet been confirmed. He believes the market is still in a mild bear phase, and that a true recovery will require patience and waiting.
GateNews12h ago
