Today, the Polkadot (DOT) price recorded an impressive increase of about 12% in just one day, surprising many traders. The main driver comes from the major upgrade on Kusama – a network closely linked to Polkadot. This event has contributed to improving short-term sentiment across the entire Polkadot ecosystem.
However, overall, the long-term trend remains unclear. DOT has still decreased approximately 53.5% over the past three months. A strong rally cannot erase the prolonged downtrend that preceded it.
Investors are now asking a big question: Is this the start of a new trend, or just a technical rebound in a weak market?
Kusama Upgrade Brings New Momentum to Polkadot Market Sentiment
The price increase of DOT is driven by Kusama – Polkadot’s testnet, where improvements are tested before official implementation. This week, Kusama deployed a notable upgrade, reducing block processing time to under 2 seconds and enhancing smart contract support. Transactions are faster, and expanded development tools attract more community interest.
Although this upgrade occurred on Kusama, not directly on Polkadot, the two networks are closely connected. Therefore, improvements on Kusama often influence market sentiment and DOT’s price.
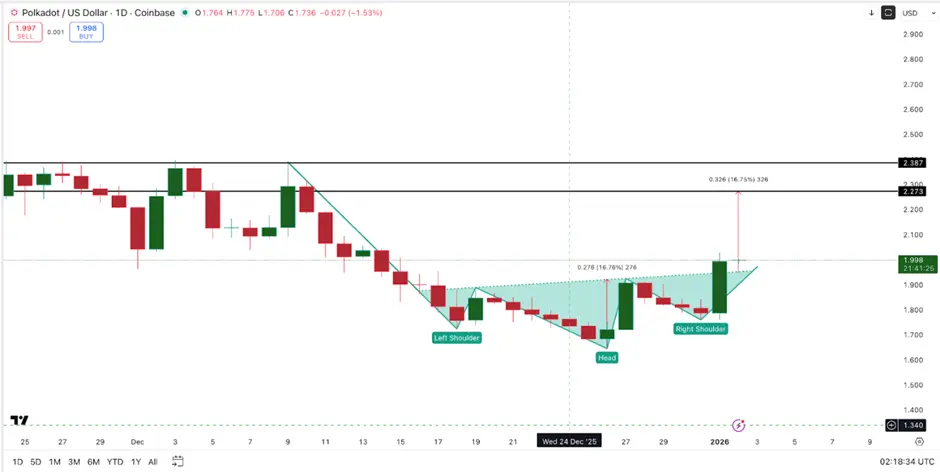 Polkadot DOT Price Surge | Source: TradingView Positive reactions from the cryptocurrency market to technical changes are common. An upgrade can create a “story” in the short term, attracting speculative capital and causing significant price volatility.
However, for a sustainable upward trend, real capital flow and demand must align. This remains a weak point in this rally.
DOT Chart Signals Breakout, but Buying Pressure Is Not Yet Strong Enough
From a technical analysis perspective, DOT recently broke the inverse head and shoulders pattern – often appearing at bottoms and signaling a potential trend reversal. If the rally continues, DOT could target the $2.27 level, representing an additional potential increase of about 13% from current levels. This is why DOT is back in the spotlight for many investors.
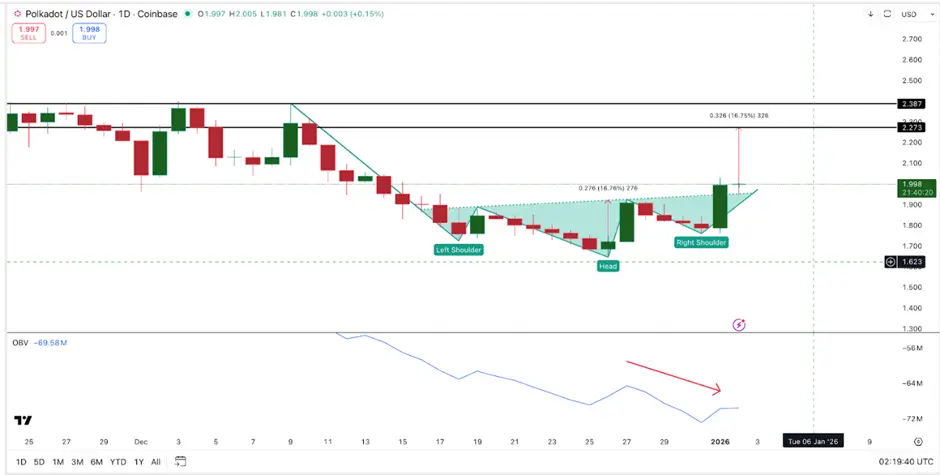 DOT Volume | Source: TradingView However, price patterns need to be confirmed by actual buying strength. The On-balance Volume (OBV) indicator – which tracks whether buyers or sellers control the trend – is still trending downward, indicating that trading volume has not fully aligned with the price. This often reflects uncertain market sentiment.
Similarly, the Chaikin Money Flow (CMF) indicator – measuring money flow into/out of the asset – remains below zero, suggesting large investors have not yet fully entered the market.
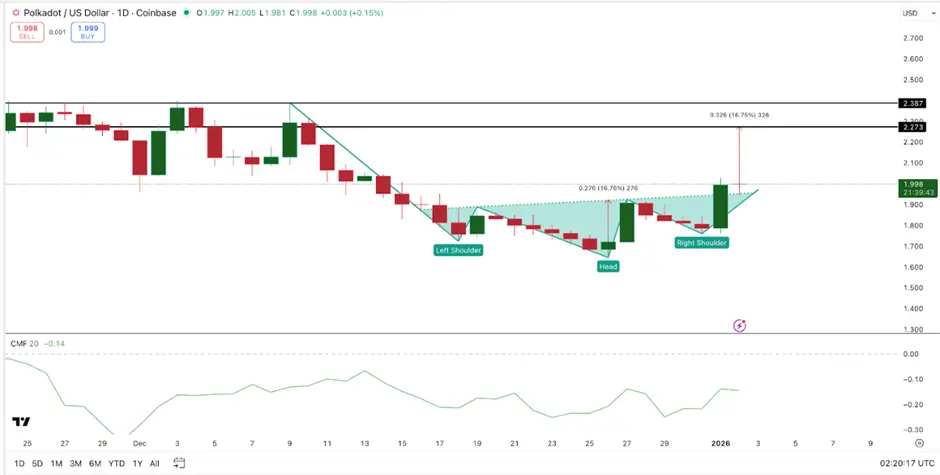 DOT CMF Indicator | Source: TradingView The DOT balance on exchanges has not changed significantly, reflecting that the recent price increase is mainly driven by short-term sentiment rather than strong capital inflows.
In summary, although technical charts show positive signals, the fundamental factors related to capital flow have not yet fully supported a sustained rally.
Important Price Levels of DOT to Watch
In the context of mixed indicators, identifying key price zones becomes more important than peripheral information.
If DOT stays above $2.02, the bullish outlook remains. This is a short-term support zone, maintaining the breakout structure.
Conversely, if DOT drops below $1.76, the technical pattern will weaken, buying pressure may retreat, and market confidence could decline rapidly.
If DOT breaks below $1.64, the recovery is likely to end, and the price could revert to a prolonged downtrend.
Currently, DOT’s movement remains uncertain. The Kusama upgrade provides upward momentum, and technical charts create trading opportunities, but what’s missing is confirmation from trading volume and capital flow. Without improvements in these factors, DOT’s rally may be only temporary.
Disclaimer: The information on this page may come from third parties and does not represent the views or opinions of Gate. The content displayed on this page is for reference only and does not constitute any financial, investment, or legal advice. Gate does not guarantee the accuracy or completeness of the information and shall not be liable for any losses arising from the use of this information. Virtual asset investments carry high risks and are subject to significant price volatility. You may lose all of your invested principal. Please fully understand the relevant risks and make prudent decisions based on your own financial situation and risk tolerance. For details, please refer to
Disclaimer.
Related Articles
Bitcoin Quantum Computing Threat Is Manageable, Real Issue Is Governance: Analyst
Gate News message, April 25 — Bitcoin analyst James Check said quantum computing poses a "manageable risk" rather than a systemic threat to Bitcoin, according to CoinDesk. Approximately 1.7 million BTC are held in Satoshi-era addresses, which could face risk if quantum computing breaks elliptic
GateNews26m ago
Positioned or Left Behind? Altcoins Show Pre-Breakout Momentum with 150%+ Upside — 5 Coins Worth Buying Today
Liquidity is rotating selectively into both DeFi and infrastructure tokens.
Meme assets show higher volatility compared to utility-driven protocols.
Market conditions resemble early-stage accumulation before potential expansion phases.
Market participants are observing renewed accumulati
CryptoNewsLand1h ago
Altcoins Are Not a Lottery: Why Discipline Beats Hype — Top 5 Crypto Coins Worth Buying This Cycle
Markets favor disciplined allocation over hype, with Chainlink/Uniswap tied to DeFi liquidity, and stablecoins as buffers; altcoin cycles face structural shifts amid cautious, liquidity-driven strategies.
Abstract: The article highlights a secular shift in crypto markets from speculative cycles to disciplined, liquidity-aware allocation. It links Chainlink and Uniswap activity to actual DeFi usage and liquidity trends, while stablecoins USDT and USDC serve as buffers amid uncertainty. The outlook emphasizes macro conditions and liquidity shifts as primary determinants of market direction, with institutional actors adopting structured approaches.
CryptoNewsLand2h ago
SUI Price Eyes $1.10 Breakout as Whale Positions Rise
Key Insights
SUI trades at $0.96 with RSI at 53.66, showing neutral momentum while maintaining upside room for expansion toward resistance levels.
Whale positioning at 70% long signals strong institutional confidence, aligning with rising open interest and steady capital inflows despite
CryptoNewsLand5h ago
ADA Price Outlook as Cardano Lands LSE Tokenized Deal
Key Insights
Cardano tokenized a Hannover Re reinsurance product and listed it on the London Stock Exchange, expanding blockchain use in regulated institutional markets.
ADA price holds within a descending wedge as support at $0.2400 remains intact while resistance near $0.2550 and $0.2824 l
CryptoNewsLand5h ago
PEPE Price Climbs as Bulls Test Key Resistance Breakout
Key Insights
Pepe’s price rises for three days as improving sentiment boosts retail demand, supported by stronger participation and steady gains in futures open interest.
Futures open interest climbs above $213 million, signaling growing trader confidence as rising positions align with
CryptoNewsLand5h ago