When 2026 kicks off, Bittensor (TAO) is showing promising signs of entering a strong growth cycle. The breakout trend, improving market sentiment, and the overall recovery of the cryptocurrency market are laying a solid foundation for this scenario. Notably, a series of bold forecasts from analysts on the X platform have quickly made TAO a name attracting special attention.
Specifically, on January 2nd, TAO’s price recorded an impressive 9.55% increase within 24 hours, trading around $242 at the time of writing. Not only did the price surge, but market activity also became noticeably more vibrant with trading volume skyrocketing by 42%, reaching nearly $89.87 million.
The synchronized movement of price and volume indicates that capital is flowing back, reflecting increasing interest from both short-term traders and long-term investors.
Why is Bittensor (TAO) surging today?
Amid the upward momentum and increasingly active capital inflow, investors can’t help but ask: what is driving TAO’s breakout after weeks of sideways trading?
The main catalyst for this rally seems to stem from the market recovery, combined with the news that Grayscale Investments officially filed for an ETF with the SEC on 12/30/2025. Specifically, Grayscale submitted Form S-1 to the U.S. Securities and Exchange Commission (SEC) to convert Bittensor Trust into an ETF with the ticker GTAO. If approved, this will be the first ETF listed in the U.S. linked to TAO, following the successful approach Grayscale has previously implemented with Bitcoin and Ethereum.
Additionally, the optimistic sentiment among traders is further fueling TAO. Derivative data from Coinglass shows leveraged long positions dominating over short positions. Notably, the price levels of $221.7 and $250.2 recorded high leverage usage, with total long position value reaching $4.65 million compared to $1.73 million on the short side. This partly reflects the market’s short-term expectations still leaning toward a bullish scenario for TAO.
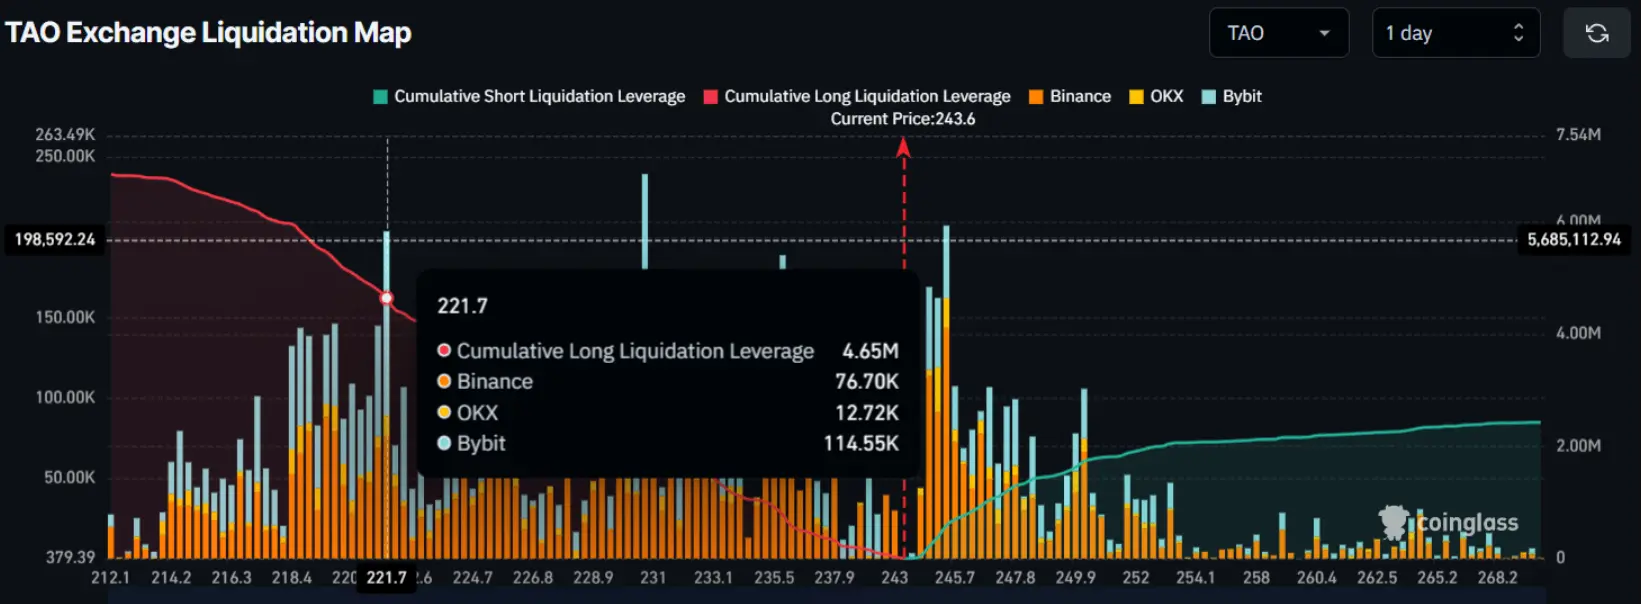 Source: Coinglass## Technical Outlook
Technical analysis on the daily timeframe indicates that the recent upward momentum could be a catalyst for a more substantial growth phase for TAO in the near future.
In a market still prone to volatility, TAO has demonstrated notable resilience by successfully testing key support levels around $207 multiple times and maintaining an accumulation phase there for nearly two weeks. Importantly, the recent breakout has helped this altcoin escape a prolonged sideways range, breaking through a technical barrier that previously limited its upward movement.
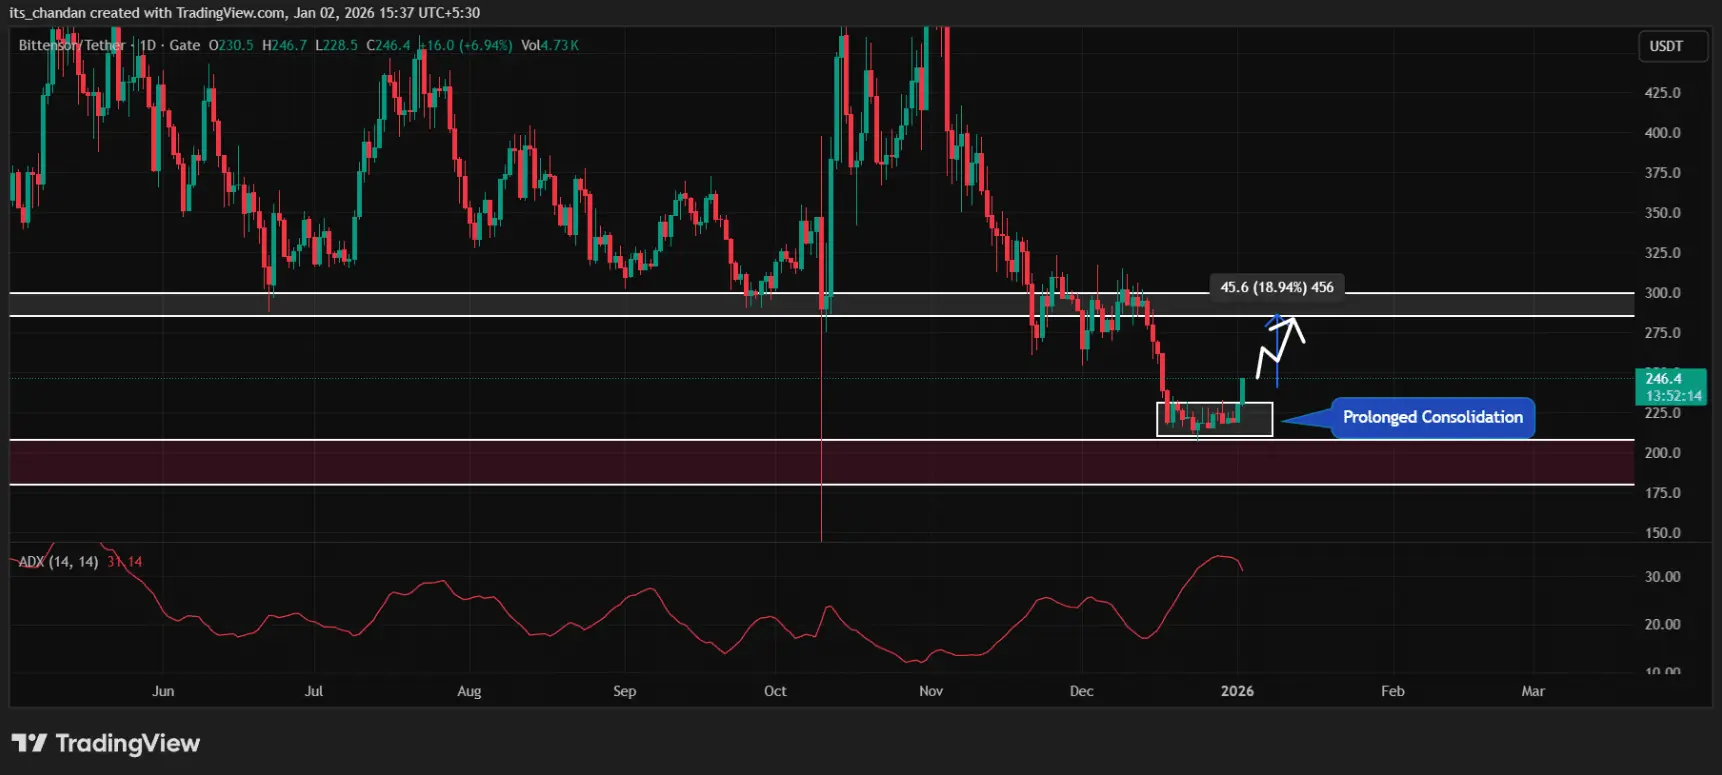 Source: TradingViewRegarding price scenario, if TAO can close the daily candle firmly above $235, the bullish trend is likely to be reinforced, opening up room for approximately 18% upside toward the next resistance zone around $285. Conversely, if the $235 level cannot be maintained, the bullish outlook may be invalidated.
Interestingly, the Average Directional Index (ADX) currently stands at 31, well above the 25 threshold—an indicator of trend confirmation—indicating that the upward momentum on the TAO chart is quite strong.
Not only do technical signals and derivative market data support the bullish trend, but the cryptocurrency analysis community is also showing clear optimism. On the X platform, many experts estimate TAO has the potential to increase by 40% to 50%, with some forecasts even expecting gains exceeding 60% in the coming days.
SN_Nour
Disclaimer: The information on this page may come from third parties and does not represent the views or opinions of Gate. The content displayed on this page is for reference only and does not constitute any financial, investment, or legal advice. Gate does not guarantee the accuracy or completeness of the information and shall not be liable for any losses arising from the use of this information. Virtual asset investments carry high risks and are subject to significant price volatility. You may lose all of your invested principal. Please fully understand the relevant risks and make prudent decisions based on your own financial situation and risk tolerance. For details, please refer to
Disclaimer.
Related Articles
BTC rises 0.58% in 15 minutes: whale large-capital transfers and derivatives defensive positioning drive spot buying
2026-04-20 06:30 to 2026-04-20 06:45 (UTC), the BTC price recorded a +0.58% return rate. The candlestick range was 74347.7 to 74898.0 USDT, with an amplitude of 0.74%. During this period, market attention increased because large orders and on-chain capital flow showed abnormal fluctuations, resulting in a higher overall volatility.
The main driver behind this anomalous move is whale entities concentrating large withdrawals and transfers targeting exchanges. Over the past 24 hours, the total reached 3,824 BTC, directly reducing the exchange’s BTC liquidity and bringing increased buy pressure to the spot market. On-chain data shows that the value of large transfers per transaction exceeding 1 million US dollars rose significantly during this window. As exchange immediate liquidity contracted, it pushed the BTC price upward in the short term. In addition, the derivatives market’s positioning structure changed: total futures open interest (OI) fell, and some defensive options positions shifted toward spot buying, further strengthening upside momentum.
Second, overall market liquidity remains in a fragile range. Order book data shows that large market buy orders were heavily concentrated, and buy-side depth increased noticeably. Meanwhile, in the same period, market Mempool activity and on-chain transaction fees were at low levels, and trading activity declined—making the impact of large single transfers and buy orders on price more pronounced. At the same time, leveraged funds leaving the derivatives market and options’ “maximum pain” strike price being below the spot price increased the spot market’s sensitivity to volatility. With multiple factors converging, the short-term upward price impulse was amplified.
Currently, market liquidity risk is rising, and in the short term the price is dominated by large buy orders in the order book and on-chain whale liquidity. Traders should continue to monitor the direction of whale capital flows and changes in exchange reserves, and be alert to possible price pullbacks caused by capital returning. At the same time, the key support range (72,000–74,000 USDT), order book depth, and derivatives positioning structure remain the core monitoring indicators for near-term volatility. Investors should be mindful of the risks stemming from fragile short-term liquidity and keep an eye on more real-time market developments.
GateNews18m ago
Spark's Prudent ETH Lending Strategy Proves Justified as Aave Faces Liquidity Crisis Across Multiple Chains
Spark's strategy chief defended maintaining high borrowing rates on SparkLend despite user migration to Aave, citing current market conditions. Aave is experiencing liquidity issues, raising concerns about potential bad debt if ETH prices drop significantly.
GateNews19m ago
BTC 15-minute rise of 0.53%: Institutional derivatives adding positions drives a short-term rebound
Between 2026-04-20 01:30 and 2026-04-20 01:45 (UTC), the BTC spot price fluctuated within a narrow range of 74290.9 to 74709.7 USDT. Over the 15-minute period, the return was +0.53%, with a range of 0.56%. Overall market volatility increased, drawing attention, but the number of active on-chain addresses remained steady, with no sign of extreme capital movements.
The main driver behind this move is institutional capital inflows into mainstream futures platforms and adjustments to derivatives position structures, especially CME futures open interest (OI), which rose against the trend by 2.61%. Meanwhile, some institutions added to defensive hedges and positioned for short-term rebounds within the price consolidation range. In addition, short-term Put options trading on platforms such as Deribit was active: the main contracts were concentrated on near-term downside protection, indicating that derivatives capital has increased its allocation to defensive strategies and that the spot market has passively followed the upward move.
In addition, ETF funds recorded $1.87 billion in net inflows in Q1, easing the consecutive net outflow trend seen earlier before March and providing medium-term background support for spot prices. Although on-chain active addresses over 1 hour stayed in the 19500–19600 range without abnormal increases or decreases, structural behavior by institutions across the derivatives and ETF markets converged to push short-term price volatility higher. There were no signals of sell pressure from retail traders or major whales, and no large transfers or extreme liquidation events; overall momentum came from institutional-level maneuvering.
It is worth noting that the derivatives market Put/Call ratio remains on the high side. If the price cannot continue moving upward, short-term exit pressure could intensify at any time. With overall OI shrinking, the activity of leveraged funds in the market weakens. Going forward, it is important to focus on changes in derivatives positions, ETF fund flows, and the in-and-out movements of active capital on-chain in order to respond to the risk of sharp short-term volatility. For more market information, it is recommended to continuously track relevant data indicators and capital-level anomalies.
GateNews5h ago
On-Chain Analyst ZachXBT Flags 6 Altcoins for Suspicious Price Manipulation
On-chain analyst ZachXBT flagged six altcoins (SIREN, MYX, COAI, M, PIPPIN, RIVER) for suspicious price movements akin to the RAVE token case, urging exchanges to act swiftly against market manipulation to protect retail investors.
GateNews8h ago
BTC falls 0.44% in 15 minutes: ETF fund outflows and derivatives shorts add to the slide
From 21:45 to 22:00 (UTC) on April 19, 2026, the BTC price dropped by 0.44% within 15 minutes. The candlestick range was 74,366.1 to 74,789.3 USDT, with an amplitude of 0.57%. Short-term volatility was concentrated. During this period, the trading volume for large orders rose significantly, market attention increased, and volatility intensified.
The main driving force behind this deviation was that U.S. spot Bitcoin ETFs saw a large net outflow of $291 million over two days from April 18 to April 19. This reflected institutional funds pulling away in the short term, which led to a marked increase in sell pressure in the spot market. At the same time, BTC perpetual contract
GateNews9h ago
Dogecoin Holds $0.094 as X Cashtags Drive Market Attention
Key Insights
Dogecoin holds above $0.094 despite market weakness as Bitcoin and Ethereum stabilize, reflecting resilience and sustained demand across major cryptocurrencies during the consolidation phase.
X launches smart cashtags enabling real-time crypto and stock tracking, improving marke
CryptoNewsLand11h ago
