
**Date: **Wed, Jan 07, 2026 | 06:20 AM GMT
The broader cryptocurrency market continues to show strong New Year momentum, with Bitcoin (BTC) up around 4% and Ethereum (ETH) gaining over 9% on a weekly basis. This improving sentiment is gradually spilling over into major altcoins — including the DePIN-focused token Akash Network (AKT).
AKT has already posted an impressive 20% weekly gain. While this short-term strength has caught traders’ attention, the more important development is unfolding on the higher-timeframe chart. Recent price action suggests a meaningful shift in market structure, hinting that AKT may be transitioning out of a prolonged corrective phase and into the early stages of a bullish continuation.
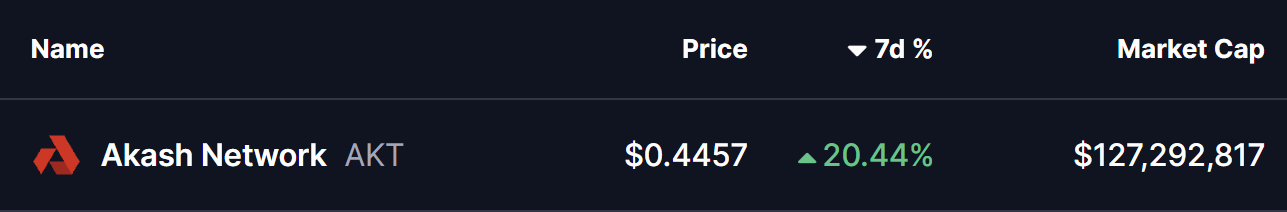
Source: Coinmarketcap
Falling Wedge and Rounding Bottom in Play
On the daily chart, AKT has been trading within a broader falling wedge — a structure that often precedes bullish reversals as selling pressure gradually weakens. Within this larger wedge, price action is also shaping a developing rounding bottom pattern, reflecting steady accumulation and seller exhaustion.
The formation began after AKT faced strong rejection near the $0.5441 resistance zone in late November. That rejection triggered a sharp sell-off, pushing price lower toward the $0.3465 region. However, bears failed to extend losses beyond this area. Instead, demand stepped in, downside momentum slowed, and price began to stabilize.
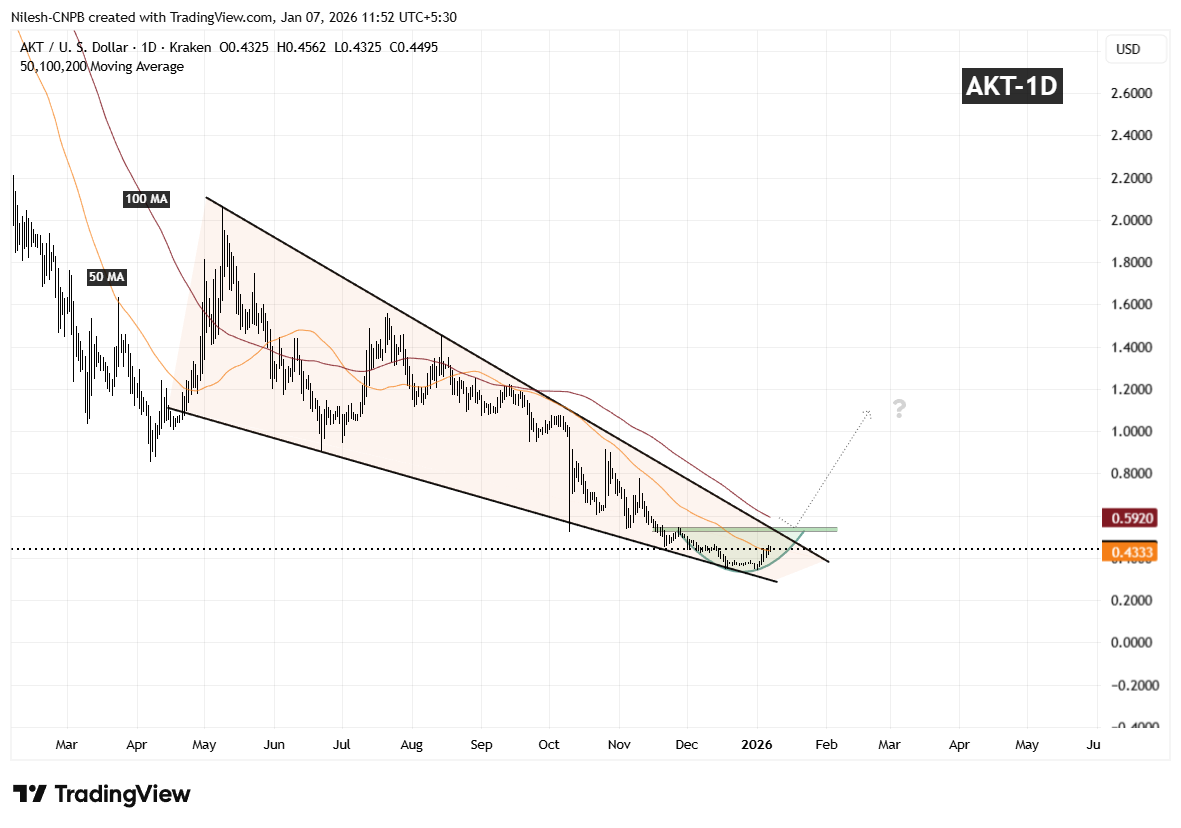
Akash Network (AKT) Daily Chart/Coinsprobe (Source: Tradingview)
Over the following weeks, volatility compressed and AKT started to curl higher in a smooth, rounded fashion — closely matching the textbook behavior of a rounding bottom. Importantly, the recent rebound has pushed price back above the 50-day moving average around $0.4333, a level that had previously acted as resistance and is now beginning to flip into support.
What’s Next for AKT?
If AKT can continue to hold above the 50-day moving average, this area may act as a solid base for further upside attempts. From here, attention shifts toward the descending resistance trendline of the falling wedge, which aligns closely with the $0.5441 resistance zone.
A clean and decisive breakout above this confluence area, followed by sustained acceptance, would confirm a broader bullish expansion phase and mark a clear trend reversal from the prior downtrend. Such a move would likely attract renewed momentum participation as the market recognizes the structural shift.
Until that breakout occurs, the pattern remains in development. Short-term consolidation or shallow pullbacks are still possible as price digests recent gains. However, as long as AKT continues to print higher lows above the established base, the broader technical structure remains constructive.
Overall, the chart suggests AKT is approaching a critical inflection point — one that could determine whether this recovery evolves into a sustained bullish trend as 2026 progresses.
Disclaimer: The views and analysis presented in this article are for informational purposes only and reflect the author’s perspective, not financial advice. Technical patterns and indicators discussed are subject to market volatility and may or may not yield the anticipated results. Investors are advised to exercise caution, conduct independent research, and make decisions aligned with their individual risk tolerance.
About Author: Nilesh Hembade is the Founder and Lead Author of Coinsprobe, with over 5 years of experience in the cryptocurrency and blockchain industry. Since launching Coinsprobe in 2023, he has been providing daily, research-driven insights through in-depth market analysis, on-chain data, and technical research.
Disclaimer: The information on this page may come from third parties and does not represent the views or opinions of Gate. The content displayed on this page is for reference only and does not constitute any financial, investment, or legal advice. Gate does not guarantee the accuracy or completeness of the information and shall not be liable for any losses arising from the use of this information. Virtual asset investments carry high risks and are subject to significant price volatility. You may lose all of your invested principal. Please fully understand the relevant risks and make prudent decisions based on your own financial situation and risk tolerance. For details, please refer to
Disclaimer.
Related Articles
The Crypto Fear and Greed Index drops to 14, and the market remains in extreme fear
Gate News message, April 9, according to Alternative data, today’s Crypto Fear and Greed Index is 14 (yesterday was 17), and the market remains in extreme fear. The index ranges from 0-100 and provides a composite assessment of six indicators: volatility (25%), market trading volume (25%), social media buzz (15%), market surveys (15%), Bitcoin’s share of the entire market (10%), and Google trending topic analysis (10%).
GateNews37m ago
Optimism over the Iran-U.S. ceasefire helped drive a broad rebound in U.S. stocks, and Bitcoin rose to a three-week high.
The United States and Iran reached a two-week ceasefire agreement, and global financial markets turned optimistic, with the S&P 500 rising 2.51%. U.S. crude oil prices fell to below $95 per barrel, easing concerns about an energy crisis. Bitcoin at one point rose 5% to $72,841, hitting a three-week high. Expectations that the Federal Reserve will cut interest rates have also increased.
ChainNewsAbmedia1h ago
Bitcoin ETF attracts $470 million, setting a 6-week high! Analyst: “A breakout rally is brewing.”
U.S. spot Bitcoin ETF inflows hit a new six-week high on Monday, signaling a rebound in institutional investor confidence. Total net inflows of $471.3 million came mainly from institutions such as BlackRock and Fidelity. Even though market sentiment is gradually improving, broader macroeconomic and geopolitical risks could still affect Bitcoin’s upward momentum. Analysts said that sustained structural buying can support Bitcoin, but future price action will still need to be monitored for changes in external factors.
区块客1h ago
XRP Traders Face Losses as Supply in Profit Hits Lows
XRP traders are experiencing significant losses, with average wallet returns down 41% and only 43.4% of the supply in profit, indicating broad market declines. The price hovers around $1.33, facing resistance while momentum remains weak.
CryptoFrontNews1h ago
Onchain Perp DEX Volume Falls for Fifth Straight Month as March Drops to $699B
Onchain perpetual futures trading has sharply declined for five consecutive months, with March 2026 volume dropping to $699 billion from a peak of $1.36 trillion in October 2025. Hyperliquid dominates the market, capturing 34% of recent trading activity.
CryptoNewsFlash2h ago
XRP Whales Accumulate as Ripple Executives Head to Key XRPL Event in Japan
XRP has gained 5% from a support level of $1.28 due to increased whale accumulation, with large holders now buying over 11 million XRP daily. Ripple executives are attending a significant XRPL event in Japan, though broader market sentiment remains cautious amid geopolitical tensions.
CryptoNewsFlash3h ago
