
**Date: **Wed, Jan 07, 2026 | 06:20 AM GMT
The broader cryptocurrency market continues to show strong New Year momentum, with Bitcoin (BTC) up around 4% and Ethereum (ETH) gaining over 9% on a weekly basis. This improving sentiment is gradually spilling over into major altcoins — including the DePIN-focused token Akash Network (AKT).
AKT has already posted an impressive 20% weekly gain. While this short-term strength has caught traders’ attention, the more important development is unfolding on the higher-timeframe chart. Recent price action suggests a meaningful shift in market structure, hinting that AKT may be transitioning out of a prolonged corrective phase and into the early stages of a bullish continuation.
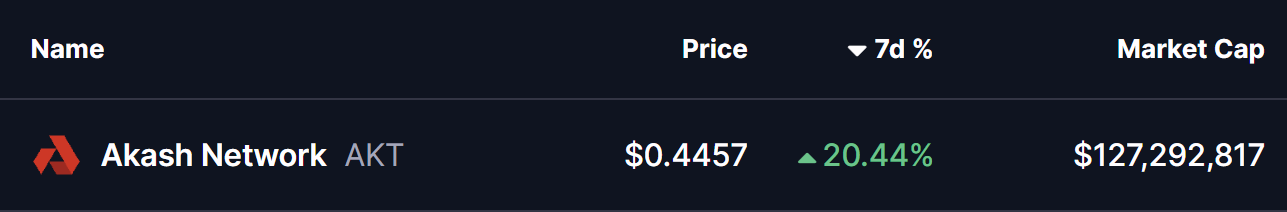
Source: Coinmarketcap
Falling Wedge and Rounding Bottom in Play
On the daily chart, AKT has been trading within a broader falling wedge — a structure that often precedes bullish reversals as selling pressure gradually weakens. Within this larger wedge, price action is also shaping a developing rounding bottom pattern, reflecting steady accumulation and seller exhaustion.
The formation began after AKT faced strong rejection near the $0.5441 resistance zone in late November. That rejection triggered a sharp sell-off, pushing price lower toward the $0.3465 region. However, bears failed to extend losses beyond this area. Instead, demand stepped in, downside momentum slowed, and price began to stabilize.
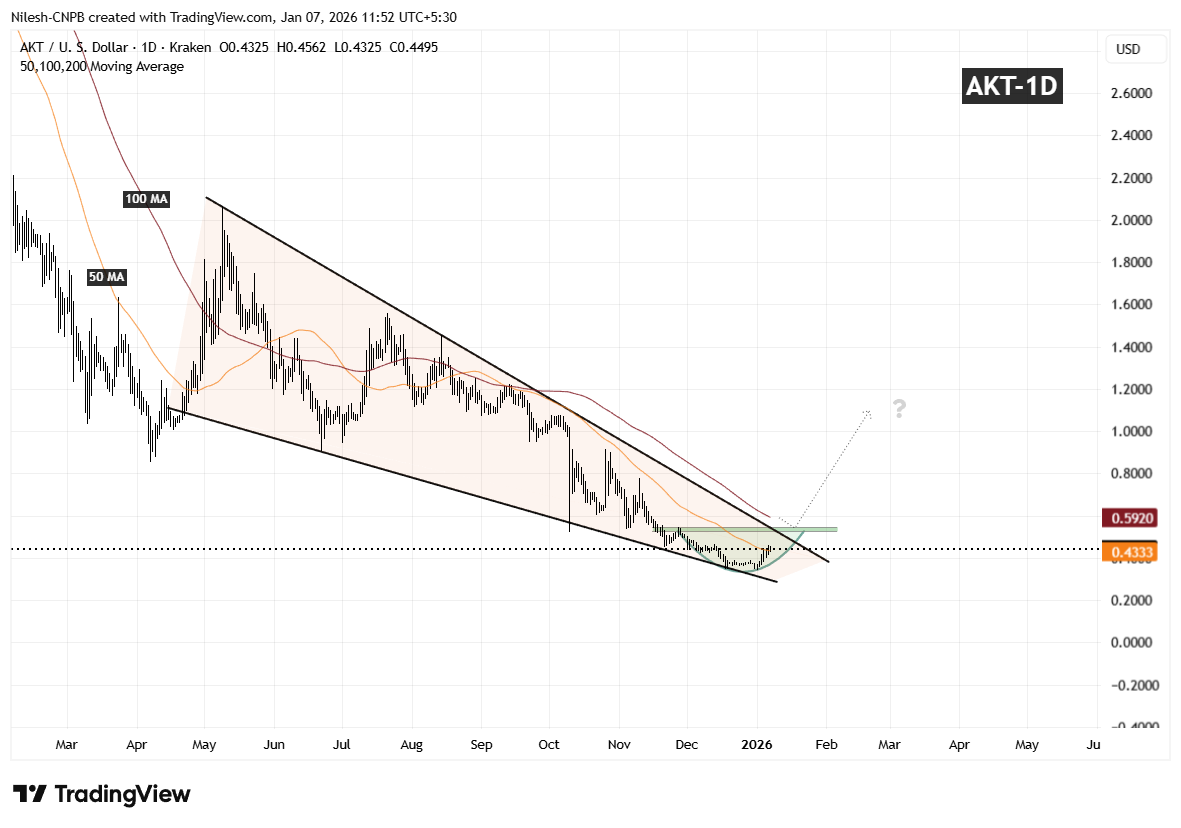
Akash Network (AKT) Daily Chart/Coinsprobe (Source: Tradingview)
Over the following weeks, volatility compressed and AKT started to curl higher in a smooth, rounded fashion — closely matching the textbook behavior of a rounding bottom. Importantly, the recent rebound has pushed price back above the 50-day moving average around $0.4333, a level that had previously acted as resistance and is now beginning to flip into support.
What’s Next for AKT?
If AKT can continue to hold above the 50-day moving average, this area may act as a solid base for further upside attempts. From here, attention shifts toward the descending resistance trendline of the falling wedge, which aligns closely with the $0.5441 resistance zone.
A clean and decisive breakout above this confluence area, followed by sustained acceptance, would confirm a broader bullish expansion phase and mark a clear trend reversal from the prior downtrend. Such a move would likely attract renewed momentum participation as the market recognizes the structural shift.
Until that breakout occurs, the pattern remains in development. Short-term consolidation or shallow pullbacks are still possible as price digests recent gains. However, as long as AKT continues to print higher lows above the established base, the broader technical structure remains constructive.
Overall, the chart suggests AKT is approaching a critical inflection point — one that could determine whether this recovery evolves into a sustained bullish trend as 2026 progresses.
Disclaimer: The views and analysis presented in this article are for informational purposes only and reflect the author’s perspective, not financial advice. Technical patterns and indicators discussed are subject to market volatility and may or may not yield the anticipated results. Investors are advised to exercise caution, conduct independent research, and make decisions aligned with their individual risk tolerance.
About Author: Nilesh Hembade is the Founder and Lead Author of Coinsprobe, with over 5 years of experience in the cryptocurrency and blockchain industry. Since launching Coinsprobe in 2023, he has been providing daily, research-driven insights through in-depth market analysis, on-chain data, and technical research.
Disclaimer: The information on this page may come from third parties and does not represent the views or opinions of Gate. The content displayed on this page is for reference only and does not constitute any financial, investment, or legal advice. Gate does not guarantee the accuracy or completeness of the information and shall not be liable for any losses arising from the use of this information. Virtual asset investments carry high risks and are subject to significant price volatility. You may lose all of your invested principal. Please fully understand the relevant risks and make prudent decisions based on your own financial situation and risk tolerance. For details, please refer to
Disclaimer.
Related Articles
The Good and Bad News for Ethereum (ETH) After Dumping Below $2K
ETH joined the market-wide correction over the past few days, dropping from $2,200 to a three-week low of $1,970 before it recovered slightly to the current $2,000.
This is the asset’s most crucial level for the time being, and it’s close to breaking below it. As such, analysts have rushed to
CryptoPotato25m ago
Exchange “Listing Curse” Investigation: Why do 89% of new coins end up as retail-trader bait?
After being listed on Binance, most tokens faced severe losses, with an average pullback range of 71% to 80%. Listing is no longer seen as an investment opportunity, but rather as an insider sell-off event. The main reasons include internal liquidity events, overvaluation, weak capital flows, and market saturation; only projects with real products and communities can survive in the future.
区块客58m ago
3 Promising Altcoins to Hold for Long-Term Profit — XRP, DOGE, and SOL
XRP shows strong breakout momentum, backed by bullish indicators and upcoming RLUSD launch.
DOGE forms a bullish pennant pattern, supported by strong community and key resistance breakout.
SOL gains traction through DeFi growth, with cup and handle patterns targeting higher prices.
The c
CryptoNewsLand1h ago
When to Buy Bitcoin Next? Analyst Outlines Exact Entry Levels
Bitcoin dumped hard in early February, plunging to a 15-month low of $60,000. This meant that it had shed over 50% of its value since early October when it peaked at over $126,000.
Although it has recovered roughly 20% since that low and sits close to $72,000 now, there are still some analysts
CryptoPotato1h ago
Retail investors drive widespread bitcoin selling as prices fall
Glassnode's Accumulation Trend Score indicates widespread selling led by retail investors as Bitcoin dips below $67,000, primarily from those holding under 10 BTC, while larger entities hold back, showing neutral behavior.
CoinDesk2h ago
Altcoin Bloodbath Negative Impulse Crushes Bulls at 40%!
Recent data shows negative impulse metrics dominate the altcoin market, indicating selling pressure outweighs buying momentum. Altcoins lag behind Bitcoin, struggling with weak recoveries and short-lived rallies, signaling a cautious market. A shift to positive indicators is needed for potential reversal.
Coinfomania2h ago
