
Key Takeaways
-
Gaming narrative is heating up again: Renewed strength across gaming tokens, led by Axie Infinity (AXS), is helping bring fresh attention back to Gala (GALA).
-
Strong on-chain growth supports the bullish case: GALA’s TVL has surged sharply, rising over 800% in the past week, signaling increased network activity and growing user participation.
-
Bullish reversal pattern forming: On the daily chart, GALA is shaping a right-angled descending broadening pattern, a structure often seen near trend reversals after extended consolidation.
Gaming-focused crypto tokens are quietly returning to the spotlight as risk appetite improves across the broader market. Axie Infinity (AXS) recently surged over 50% in a single day and more than 125% in the past month, reigniting interest in the gaming narrative. Riding this renewed momentum, **Gala (GALA) **has also stepped into focus, climbing nearly 9% on January 17, 2026, as overall market sentiment turns constructive.
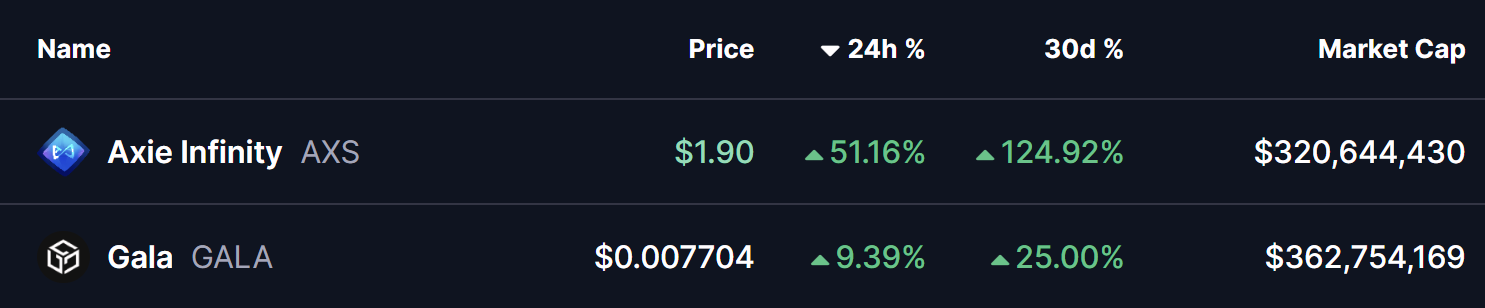
Source: Coinmarketcap
Beyond the short-term price bounce, GALA is showing notable strength beneath the surface. A sharp rise in on-chain activity combined with a technically bullish chart structure suggests the token may be coiling for a larger upside move — provided key resistance levels are cleared.
Strong TVL Growth Signals Renewed Network Activity
As gaming tokens regain traction, Gala’s ecosystem activity has expanded aggressively. Recent data from Defillama shows GALA’s total value locked (TVL) jumped by around 7.48% in the past 24 hours, while the 7-day TVL surged an impressive 864%. On a 30-day basis, TVL growth now stands near 677%, highlighting a sharp influx of capital into the network.
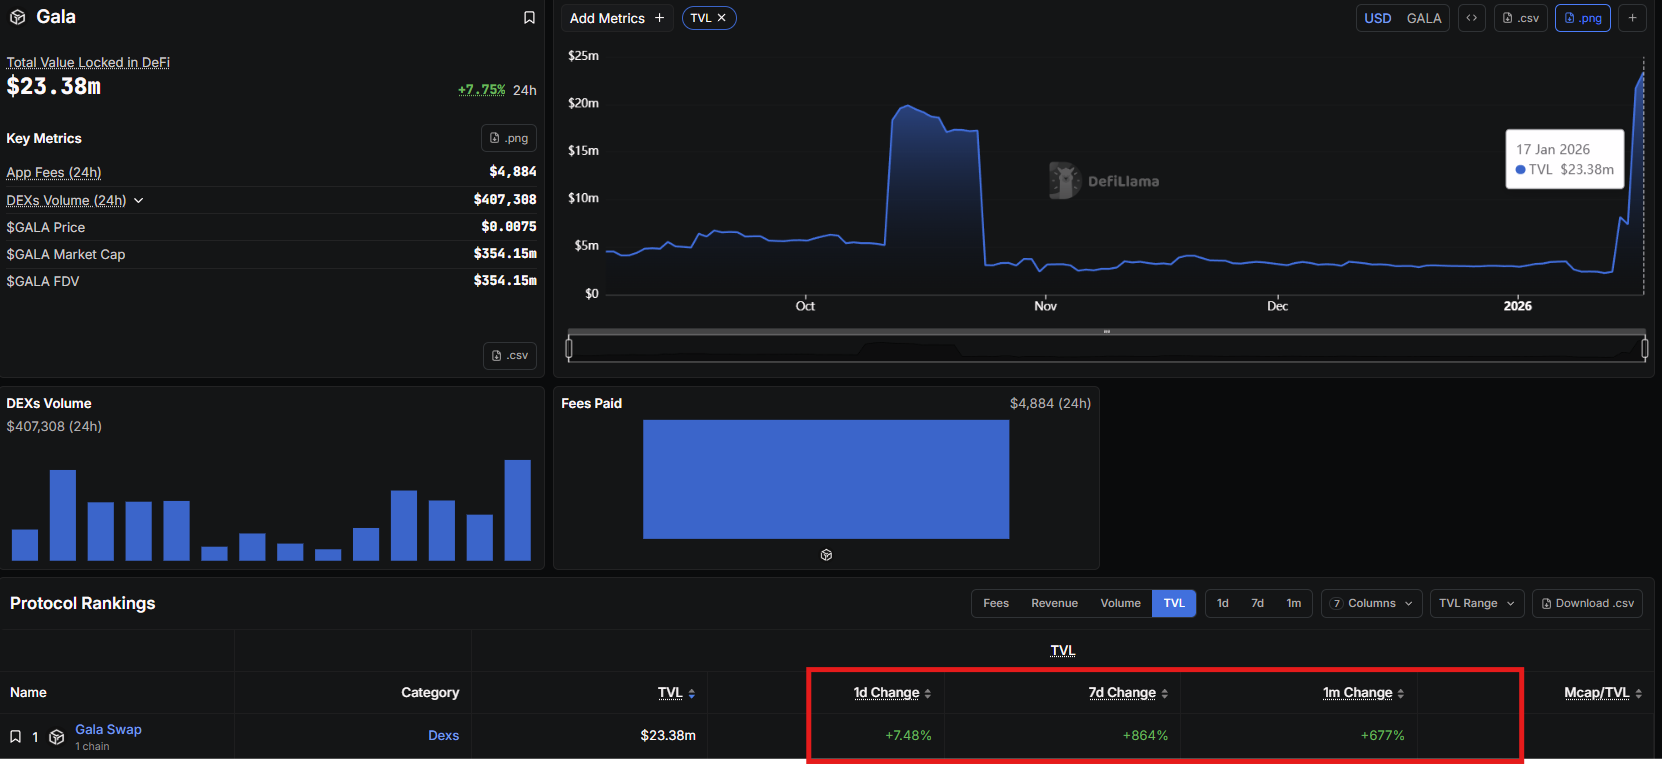
Gala Chain TVL/Source: Defillama
Such explosive growth in locked value often reflects rising participation, increased protocol usage, and renewed confidence among users. When on-chain expansion aligns with improving price structure, it typically strengthens the case for a sustained recovery rather than a short-lived relief bounce.
Right-Angled Descending Broadening Pattern in Play
From a technical standpoint, GALA’s daily chart is flashing a right-angled descending broadening formation, a pattern that often precedes bullish reversals after prolonged consolidation phases.
For several weeks, price action remained capped beneath the $0.0076–$0.0079 resistance zone, with multiple upside attempts getting rejected. Meanwhile, downside moves gradually expanded, creating the widening lower trendline that defines this structure.
Momentum began to shift after GALA rebounded strongly from the lower boundary of the pattern. Buyers stepped in decisively, pushing price higher and enabling a reclaim of the 50-day moving average near $0.00688 — a level that had previously acted as consistent dynamic resistance.
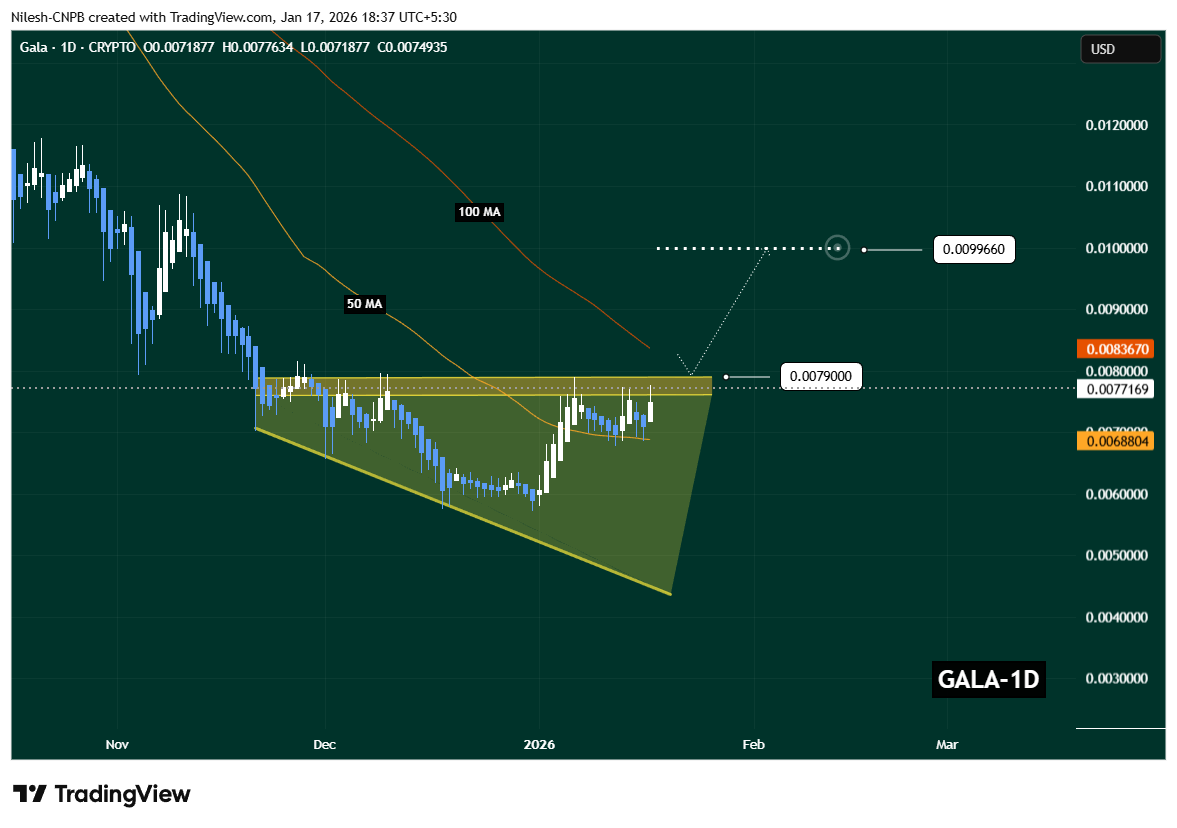
Gala (GALA) Daily Chart/Coinsprobe (Source: Tradingview)
Since then, GALA has continued to build strength, climbing back into the same resistance band that previously capped rallies. Price is now consolidating just below this ceiling, placing the token at a critical decision zone.
What’s Next for GALA?
A decisive daily close above the $0.0079 resistance, followed by a successful retest, would confirm a breakout from the descending broadening formation and validate the broader bullish reversal setup.
Based on the depth of the pattern and its measured-move projection, such a breakout could open the door toward the $0.00996 region, representing a potential upside of roughly 25% from the breakout area.
That said, patience remains important. Until a clean breakout is confirmed, short-term pullbacks remain possible, including a retest of the 50-day moving average. These dips would not invalidate the bullish structure as long as GALA continues to form higher lows.
For now, the $0.0076–$0.0079 zone remains the market’s key inflection area. How price reacts around this range will likely determine whether GALA transitions into a sustained bullish phase or remains range-bound in the near term.
Bottom Line
GALA’s surge in on-chain activity, combined with a bullish reversal pattern on the daily chart, suggests that the groundwork for a larger move may already be in place. While confirmation is still needed, the structure favors upside continuation if buyers manage to flip key resistance into support. As the gaming narrative heats up again, GALA is shaping up as one of the charts worth watching closely in the coming sessions.
Disclaimer: The views and analysis presented in this article are for informational purposes only and reflect the author’s perspective, not financial advice. Technical patterns and indicators discussed are subject to market volatility and may or may not yield the anticipated results. Investors are advised to exercise caution, conduct independent research, and make decisions aligned with their individual risk tolerance.
About Author: Nilesh Hembade is the Founder and Lead Author of Coinsprobe, with over 5 years of experience in the cryptocurrency and blockchain industry. Since launching Coinsprobe in 2023, he has been providing daily, research-driven insights through in-depth market analysis, on-chain data, and technical research.
Disclaimer: The information on this page may come from third parties and does not represent the views or opinions of Gate. The content displayed on this page is for reference only and does not constitute any financial, investment, or legal advice. Gate does not guarantee the accuracy or completeness of the information and shall not be liable for any losses arising from the use of this information. Virtual asset investments carry high risks and are subject to significant price volatility. You may lose all of your invested principal. Please fully understand the relevant risks and make prudent decisions based on your own financial situation and risk tolerance. For details, please refer to
Disclaimer.
Related Articles
Bitcoin may record its second consecutive six-month decline in history, following its first consecutive six-month drop, after which it surged by 208%.
BlockBeats news, on March 29, according to Coinglass data, Bitcoin's return rate for March this year is currently reported at -0.76%, which may mark the sixth consecutive month of decline.
Historically, Bitcoin has only experienced a similar situation once: from August 2018 to January 2019, it fell approximately 54.8% over six months. Subsequently, Bitcoin saw a continuous rise for five months (from February 2019 to June 2019), with a total increase of up to 208%.
BlockBeatNews13m ago
Altcoin XRP Makes Bullish Breakout Against Bitcoin, Projecting a Possible Massive Surge Ahead
Altcoin XRP makes bullish breakout against Bitcoin (BTC).
The asset is projected towards hitting bullish new ATH prices.
The price of XRP could surge over 600% to hit ATH targets over $10.
The crypto market prepares to see Bitcoin (BTC) make its sixth consecutive red close, a pattern
CryptoNewsLand27m ago
Over $14 billion in Bitcoin options will expire on Friday, with the market closely watching the $75,000 "magnetic price level."
This Friday, Deribit will settle approximately $14.16 billion in Bitcoin options, with the market expecting $75,000 as a key "magnet price." The current price of Bitcoin is around $71,617, still some distance from the most painful point of $75,000, and significant volatility may occur in the next two days. Although market sentiment is focused on a rebound, the demand for hedging remains high, reflecting short-term fluctuation risks.
区块客32m ago
Pi Network’s PI Token Rebounds, Bitcoin (BTC) Maintains $66K: Weekend Watch
Bitcoin's price has stabilized above $66,000 despite recent volatility influenced by geopolitical events. Altcoins, including ETH and XRP, have seen minimal movement, while some smaller coins like SIREN and PI experience notable gains. The overall crypto market cap remains steady.
CryptoPotato35m ago
85% or 200% Surge Next for Cardano? ADA Tests Key Level Linked to Historic Breakouts
Cardano’s native token has been among the poorest performers in the past year, with on-chain data suggesting that ADA active wallets are down over 40% on their investments within this timeframe.
However, this could actually be bullish for the underlying asset, especially when it’s combined with ano
CryptoPotato43m ago
The next big Bitcoin shock could be when Wall Street loses confidence and starts selling
Bitcoin's recent drop below $67,000 marks a significant correction, but unlike past declines, market reactions are noticeably calmer. The endurance of the Bitcoin spot ETF in the U.S. suggests that new holders exhibit greater patience. Despite fluctuations and macroeconomic influences, a mass sell-off hasn't occurred, indicating a shift in investor behavior that may define Bitcoin's future cycles.
TapChiBitcoin1h ago
