
Bitcoin might be quietly doing something important right now. While price action still looks messy on the surface, on-chain data is starting to tell a calmer story.
A signal shared by Crypto Patel shows the Short-Term Holder Supply Ratio flipping back above break-even, a move that has historically appeared before some of Bitcoin’s strongest rallies.
- Reading the BTC Chart Step by Step
- Why Break-Even Is a Big Deal
- What This Could Mean Next for the BTC Price
Reading the BTC Chart Step by Step
The chart titled “The Bitcoin Bottoming Process” shared by Patel puts two things together: the BTC price at the top and short-term holder profit and loss behavior underneath.
Short-term holders are investors who bought Bitcoin within the last 155 days. They are usually the first to panic and the first to sell when markets turn against them.
Earlier in the year, the BTC price fell hard from above $100,000 into the $74,000 to $84,000 zone. That drop pushed short-term holders deep into loss territory, even close to the extreme -95% loss level. This was the phase labeled as the “tariff bottom,” where forced selling peaked and fear clearly took control.
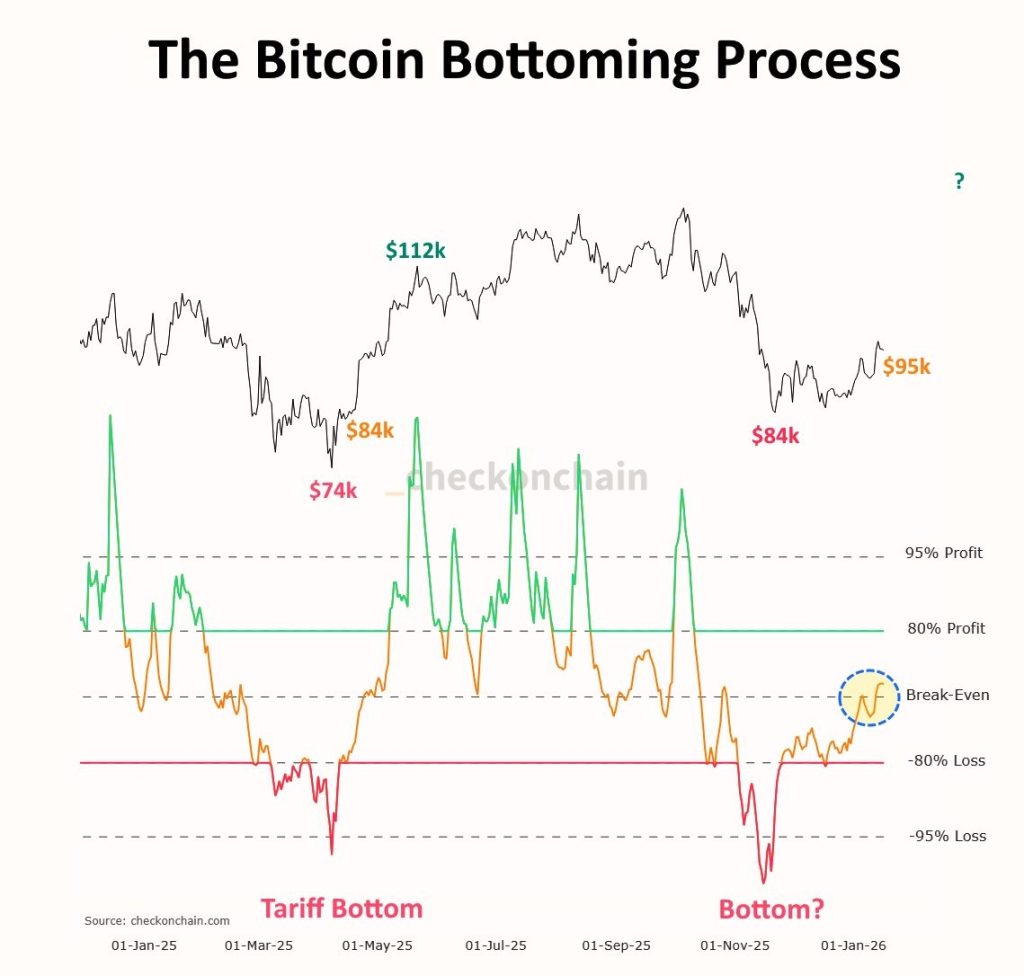
Source: X/@CryptoPatel
Later on, the BTC price returned to the $84,000 area again. On the surface, it looked like another major breakdown. But under the hood, the reaction was different.
Losses were sharp but short-lived, and the recovery in the short-term holder metric happened much faster. That tells us a lot of weak hands were already shaken out during the first sell-off.
Why Break-Even Is a Big Deal
The key moment on the chart is the recent move back above the break-even line. This is where things start to change. When short-term holders are sitting at a loss, every bounce in the BTC price becomes an excuse to sell. That creates constant overhead pressure and keeps rallies from going very far.
Once those holders move back into profit, that pressure fades. Panic selling slows down, fewer coins hit the market, and supply tightens naturally.
The chart shows that in previous cycles, similar flips above break-even didn’t mark tops. They usually showed up before sustained moves higher in the BTC price. That doesn’t mean Bitcoin goes straight up from here. In the past, this phase often came with sideways action and a few pullbacks before momentum fully returned.
Bear Market Warning: Bitcoin Faces Major Test That Defined the 2022 Crash_**
What This Could Mean Next for the BTC Price
From an on-chain perspective, Bitcoin looks more like it’s stabilizing than breaking down. As long as the BTC price stays above recent lows and short-term holders remain in profit, selling pressure should stay limited.
Macro conditions and sentiment still matter, but this chart indicates the worst of the panic may already be behind us. If history repeats, this break-even flip could be less about a short-term bounce and more about laying the foundation for the next major move in the BTC price.
Disclaimer: The information on this page may come from third parties and does not represent the views or opinions of Gate. The content displayed on this page is for reference only and does not constitute any financial, investment, or legal advice. Gate does not guarantee the accuracy or completeness of the information and shall not be liable for any losses arising from the use of this information. Virtual asset investments carry high risks and are subject to significant price volatility. You may lose all of your invested principal. Please fully understand the relevant risks and make prudent decisions based on your own financial situation and risk tolerance. For details, please refer to
Disclaimer.
Related Articles
BTC 15-minute up 0.46%: spot trading volume expansion and derivatives long position buildup as two drivers
From 2026-04-15 19:30 to 19:45 (UTC), the BTC price fluctuated between 74,706.2 and 75,276.9 USDT. Within 15 minutes, the return reached +0.46%, and the range was 0.76%. Trading activity in the market for this window was active: spot trading volume rose 18% compared with the previous hour’s average. Volatility increased in the short term, and overall market attention improved.
The main drivers behind this abnormal move are the short-term amplification of spot market trading volume and the coordinated increase in long positions in the derivatives market. Derivatives futures open interest (Open Interest) during this period, on a month-over-month basis,
GateNews3h ago
BTC Breaks Through 75000 USDT
Gate News bot 消息,Gate 行情显示,BTC 突破 75000 USDT,现价 75000 USDT。
CryptoRadar3h ago
Tether Withdraws 951 BTC Worth $70.47M from Major CEX, Holds $7.2B in Bitcoin Reserves
Tether's BTC reserve address withdrew 951 BTC valued at $70.47 million, part of Q1 2026 purchases. It now holds 97,141 BTC worth around $7.2 billion, making it the fifth-largest BTC wallet with unrealized gains of $2.175 billion.
GateNews7h ago
BTC 15-minute drop of 0.62%: Exchange net inflows and liquidity depletion in sync trigger selling pressure
2026-04-15 14:30 to 2026-04-15 14:45 (UTC), the BTC price’s return over 15 minutes was -0.62%. The quoted range was 73,905.4 to 74,448.0 USDT, with a swing of 0.73%. Market volatility quickly intensified, drawing widespread attention from investors, and short-term trading activity became active.
The main driver behind this unusual movement was BTC net inflows to exchanges. On-chain data shows that during this period, about 6 BTC ($420,690) moved into exchanges, combined with the fact that the market’s overall order book depth has been continuing since February
GateNews8h ago
Bitcoin, Ethereum and Solana ETFs Record Positive Net Inflows on April 15
Gate News message, according to the April 15 update, Bitcoin ETFs recorded a single-day net inflow of 4,566 BTC (approximately $337.41 million) and a 7-day net inflow of 6,753 BTC (approximately $499.04 million). Ethereum ETFs saw a single-day net inflow of 23,405 ETH (approximately $54.37 million)
GateNews9h ago
BTC 15-minute drop of 0.70%: Increased ETF fund outflows and a coordinated sell-pressure trigger from derivatives position adjustments
From 2026-04-15 13:30 to 13:45 (UTC), the BTC price fluctuated within the range of 73,846.3 to 74,415.9 USDT. Within 15 minutes, the return recorded -0.70%, with an amplitude of 0.77%. During this period, market volatility intensified, trading volume and on-chain transfers heated up significantly, and market participants’ risk sensitivity increased.
The main driving force behind this unusual move was a sharp increase in ETF fund outflows. Data shows that on 2026-04-13, U.S. spot Bitcoin ETFs recorded net outflows of -231.7 million dollars, far above the one-week average
GateNews9h ago
