Key Highlights
-
COW price jumps over 9% in 24 hours following CoW Swap’s launch on the Plasma Network
-
Power of 3 (PO3) pattern forming, often seen near market cycle lows
-
Price now attempting to reclaim $0.2450 support, signaling potential expansion phase
-
200-day moving average near $0.2832 stands as the next key resistance
-
Successful breakout could open upside toward $0.50 and $0.84
Cow Protocol’s native token COW is showing renewed strength after weeks of muted price action, rising over 9% in the last 24 hours following the latest ecosystem update announcing CoW Swap going live on the Plasma Network, a stablecoin-native Layer-1 focused on real-world payments.
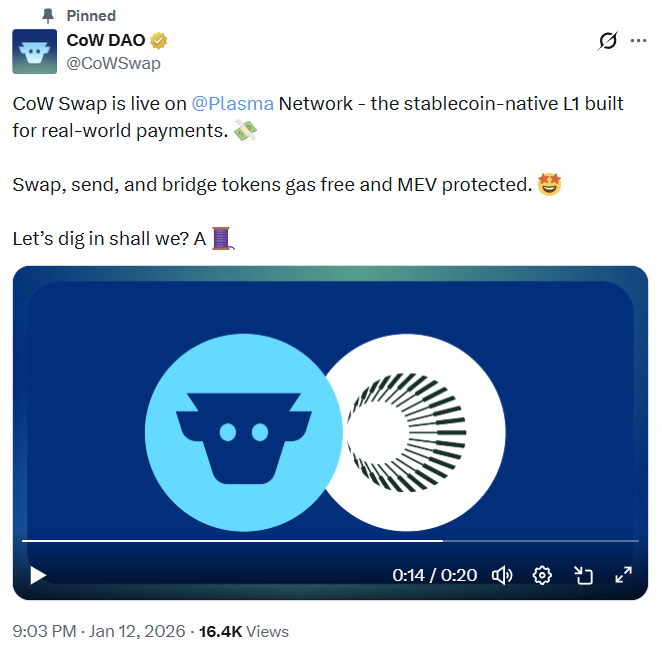
Source: @CoWSwap (X)
Beyond the short-term price pop, the daily chart structure is beginning to tell a much more interesting story, with a classic market cycle pattern quietly taking shape that could signal a larger directional move ahead.
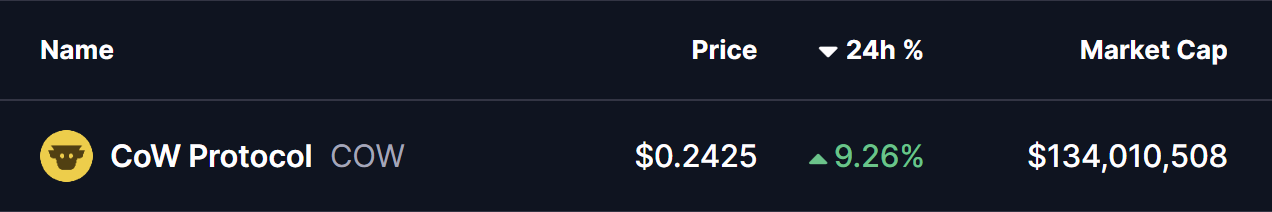
Source: Coinmarketcap
Power of 3 Pattern Taking Shape on the Chart
From a technical perspective, COW appears to be forming a Power of 3 (PO3) pattern, a structure often seen near market bottoms and early trend transitions. This pattern typically unfolds in three distinct phases: accumulation, manipulation, and expansion — with the most aggressive price movement usually occurring once the final phase begins.
Accumulation Phase: Range-Bound Base Formation
Earlier in the year, COW spent several months trading sideways inside a clearly defined range, capped by resistance near $0.50 and supported around the $0.2450 level.
This prolonged consolidation — highlighted by the gray zone on the chart — reflected steady accumulation, where long-term participants gradually built positions while volatility remained compressed. During this phase, price respected range boundaries, suggesting equilibrium between buyers and sellers rather than trend continuation.
Manipulation Phase: Liquidity Sweep Below Support
As broader market conditions weakened, COW briefly broke down below its accumulation support at $0.2450, sliding sharply toward a local low near $0.16.
This move — marked by the red-shaded zone — aligns closely with the manipulation phase of the Power of 3 pattern. Such breakdowns are often designed to trigger stop losses, shake out weak hands, and push sentiment decisively bearish.
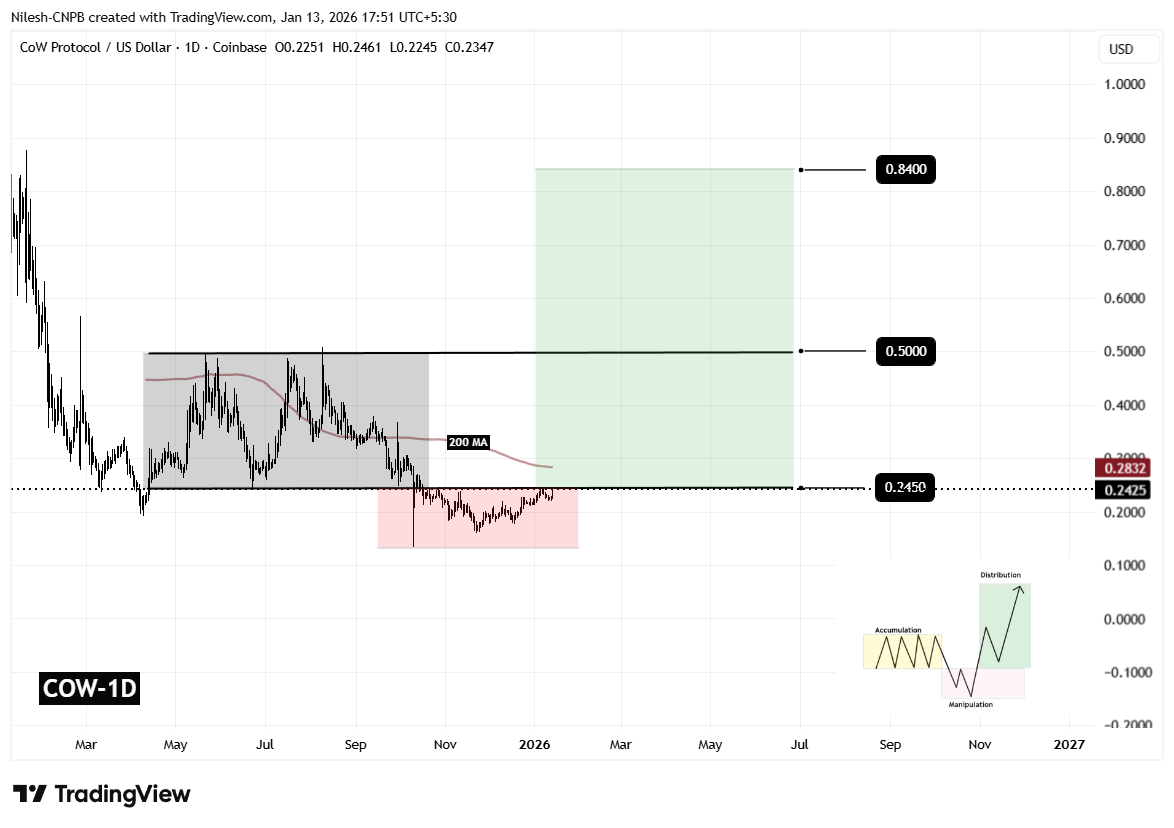
Cow Protocol (COW) Daily Chart/Coinsprobe (Source: Tradingview)
Crucially, the sell-off was short-lived. Buyers stepped in aggressively near the lows, absorbing sell pressure and preventing a sustained breakdown — an early sign that downside momentum may have been exhausted.
Expansion Phase: Is the Upside Move Beginning?
Following the liquidity sweep, COW has rebounded and is now attempting to reclaim the $0.2450 level as support. This recovery suggests the potential transition into the expansion phase, where price begins to trend away from the accumulation range.
The sharp reaction from this support zone increases the likelihood that the recent dip was corrective rather than structural, reinforcing the bullish PO3 thesis.
What’s Next for COW?
With price stabilizing above reclaimed support, attention now turns to the 200-day moving average, currently positioned near $0.2832. This level has acted as dynamic resistance and remains a key confirmation point for bulls.
-
A sustained daily close above the 200 MA would strengthen bullish momentum and increase the probability of a move toward $0.50, the top of the prior accumulation range.
-
If COW successfully reclaims and holds this zone, the Power of 3 measured move projection points to a potential upside target near $0.84, derived by extending the height of the accumulation range from the breakout level.
On the downside, failure to hold above the reclaimed support could delay or invalidate the expansion scenario, keeping COW locked in broader consolidation for longer.
Final Outlook
COW is now trading at a technically critical inflection point. The combination of a completed liquidity sweep, reclaim of key support, and improving structure suggests that a larger upside move may be developing — but confirmation remains essential.
The coming sessions will be decisive in determining whether this rebound evolves into a sustained trend or stalls below major resistance.
Frequently Asked Questions (FAQ)
What is Cow Protocol (COW)?
Cow Protocol is a decentralized finance (DeFi) platform focused on MEV-protected trading and optimal order execution, with COW serving as its native utility and governance token.
Why is COW price rising today?
COW gained momentum after CoW Swap went live on the Plasma Network, combined with a strong technical rebound from key support levels on the chart.
What is the Power of 3 pattern?
The Power of 3 (PO3) is a market structure consisting of accumulation, manipulation, and expansion phases. It often appears near market bottoms and can signal trend reversals.
What is the upside target for Cow Protocol?
If the expansion phase confirms, the projected upside target based on the PO3 pattern is around $0.84.
Is Cow Protocol a good investment?
COW shows improving technical structure, but price confirmation above resistance is still needed. Investors should conduct their own research and manage risk accordingly.
Disclaimer: The views and analysis presented in this article are for informational purposes only and reflect the author’s perspective, not financial advice. Technical patterns and indicators discussed are subject to market volatility and may or may not yield the anticipated results. Investors are advised to exercise caution, conduct independent research, and make decisions aligned with their individual risk tolerance.
About Author: Nilesh Hembade is the Founder and Lead Author of Coinsprobe, with over 5 years of experience in the cryptocurrency and blockchain industry. Since launching Coinsprobe in 2023, he has been providing daily, research-driven insights through in-depth market analysis, on-chain data, and technical research.
Disclaimer: The information on this page may come from third parties and does not represent the views or opinions of Gate. The content displayed on this page is for reference only and does not constitute any financial, investment, or legal advice. Gate does not guarantee the accuracy or completeness of the information and shall not be liable for any losses arising from the use of this information. Virtual asset investments carry high risks and are subject to significant price volatility. You may lose all of your invested principal. Please fully understand the relevant risks and make prudent decisions based on your own financial situation and risk tolerance. For details, please refer to
Disclaimer.
Related Articles
PEPE Reclaims 0.00000400 — Is This 1.8% Move the Start of a Bigger Run?
PEPE rebounds from 0.00000385 support, forming higher lows and stronger bullish structure.
Technical indicators like MACD and RSI show momentum with room for further upside.
Key resistance at 0.00000410; support at 0.00000380 critical for trend continuation.
PepeCoin — PEPE, has
CryptoNewsLand3h ago
ETH drops 0.58% in 15 minutes: derivatives liquidity contraction and proactive position reduction dominate short-term pullback
From 2026-04-19 04:30 to 2026-04-19 04:45 (UTC), within ETH’s 15-minute candlestick chart, the return recorded -0.58%, and the price range was 2321.62 to 2342.04 USDT, with an amplitude of 0.87%. The short-term selloff occurred against a backdrop of increased overall market volatility and a broad decline in the prices of major crypto assets; overall market risk appetite clearly fell, and traders’ wait-and-see sentiment strengthened.
The main driver behind this abnormal move is a sharp contraction in liquidity in the derivatives market and leveraged funds proactively reducing positions. Data shows that over the past 24 hours, the ETH/USD perpetual contract trading volume dropped 67.16% to approximately 74.87 million, open interest edged down 3.33% to 329 million, and liquidation amounts did not expand unusually. This structure indicates that the market lacks the risk of passive cascades; more funds chose to proactively step aside and wait on the sidelines, intensifying short-term selling pressure.
In addition, the long/short structure in which shorts held the upper hand (long/short ratio 47.48%:52.52%) and sentiment synchronization with the panic range reinforced the downward price trend. During the same period, major coins such as BTC and SOL also fell 2%-3.4% in tandem, further showing that this pullback was driven by system-wide risk sentiment. On-chain funds did not show any large abnormal transfers or large-scale liquidations of DeFi protocols; spot and on-chain liquidity remained generally stable, and no sudden system risk resonance was observed.
Current volatility-related risks still need close monitoring, especially as overall risk appetite continues to contract—ETH’s short-term price may face further downside probing. Watch subsequent changes in derivatives trading volume and open interest, extreme shifts in the long/short ratio and funding rate, and promptly monitor on-chain fund flows, large transfers, and any signs of amplified platform net outflows. For more market anomalies and deeper analysis, please continue to follow our upcoming market updates.
GateNews4h ago
Spark Protocol's January delisting of rsETH proves prudent as Aave faces ETH liquidity crisis
Spark Protocol's strategy of delisting low-usage assets and tightening collateral has faced initial backlash but proved wise during market turmoil. While maintaining higher interest rate caps, SparkLend ensures liquidity, unlike Aave, which now faces significant risks.
GateNews5h ago
Request Network (REQ) Surges 23.68% in 15 Minutes, 24-Hour Gain Reaches 116.52%
Request Network (REQ) surged 23.68% in just 15 minutes, reaching $0.152, with a 24-hour rise of 116.52% and trading volume over $8 million. Factors include retail interest and whale accumulation. Resistance at $0.160 and support at $0.122 are under observation.
GateNews6h ago
Solana Price Stalls Near $80 as ETF Outflows Weigh
Solana trades around $80, facing bearish sentiment due to ETF outflows and declining retail participation. Technical indicators show mixed signals, with resistance at $87 and $98, while support at $77 remains critical for stability.
CryptoFrontNews10h ago
Dogecoin Holds $0.094 as X Cashtags Drive Market Attention
Key Insights
Dogecoin holds above $0.094 despite market weakness as Bitcoin and Ethereum stabilize, reflecting resilience and sustained demand across major cryptocurrencies during the consolidation phase.
X launches smart cashtags enabling real-time crypto and stock tracking, improving marke
CryptoNewsLand13h ago
