 The post LINK Price Slips as ETFs Absorb Supply but Charts Signal More Downside appeared first on Coinpedia Fintech News
The LINK price today hovered near $11.95 at the time of writing as its spot ETFs quietly absorbed supply. While institutional inflows remain steady and on-chain accumulation continues, the market response has been still muted, raising questions about whether Chainlink’s next move requires deeper price discounts before momentum returns.
LINK ETFs Quietly Absorb Circulating Supply
According to on-chain and ETF tracking data, spot LINK ETFs have already accumulated more than 1% of Chainlink’s total circulating supply, with a market cap of $8.42 billion. The 1% makes the Total net assets across the products approximately $85.34 million.
![]() Notably, this absorption has come from just two sponsors, Grayscale and Bitwise, alone, highlighting the scale of capital concentration involved.
Notably, this absorption has come from just two sponsors, Grayscale and Bitwise, alone, highlighting the scale of capital concentration involved.
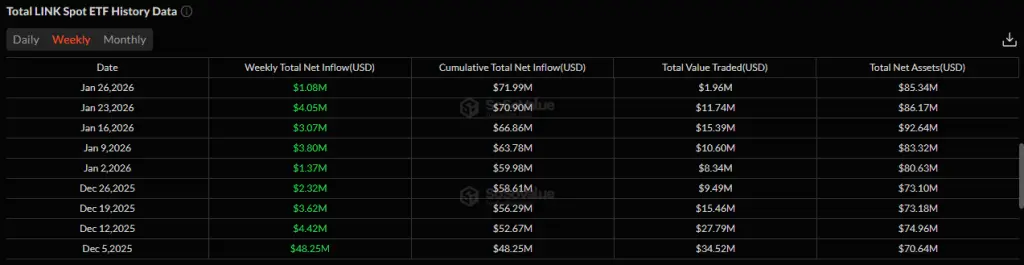 Meanwhile, ETF flow data shows no recorded weekly outflows since launch, suggesting sustained accumulation rather than speculative rotation. From a market structure perspective, this steady buying provides a longer-term demand base even as price action remains soft.
Strategic Reserves and On-Chain Accumulation Build
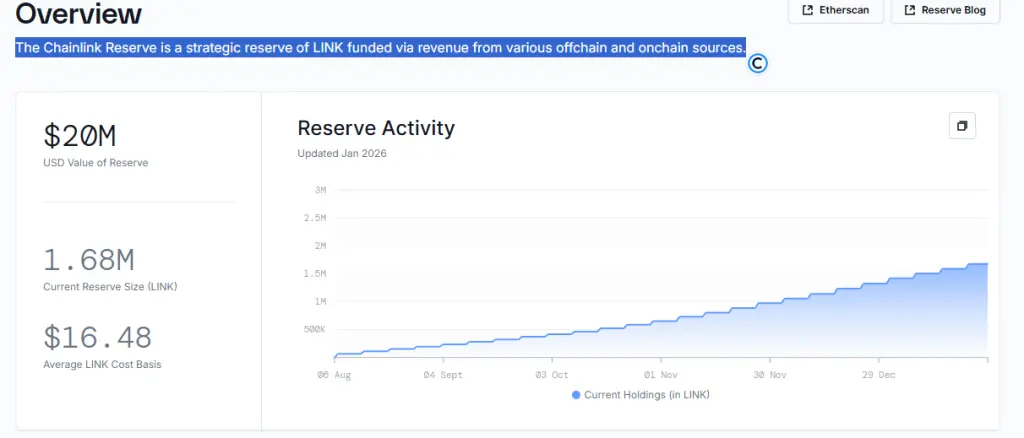
At the same time, Chainlink’s internal reserve holdings have continued to grow. The Chainlink Reserve which now holds roughly 1.68 million LINK tokens, funded through a mix of on-chain and off-chain revenue streams. This expansion reinforces the protocol’s long-term sustainability strategy.
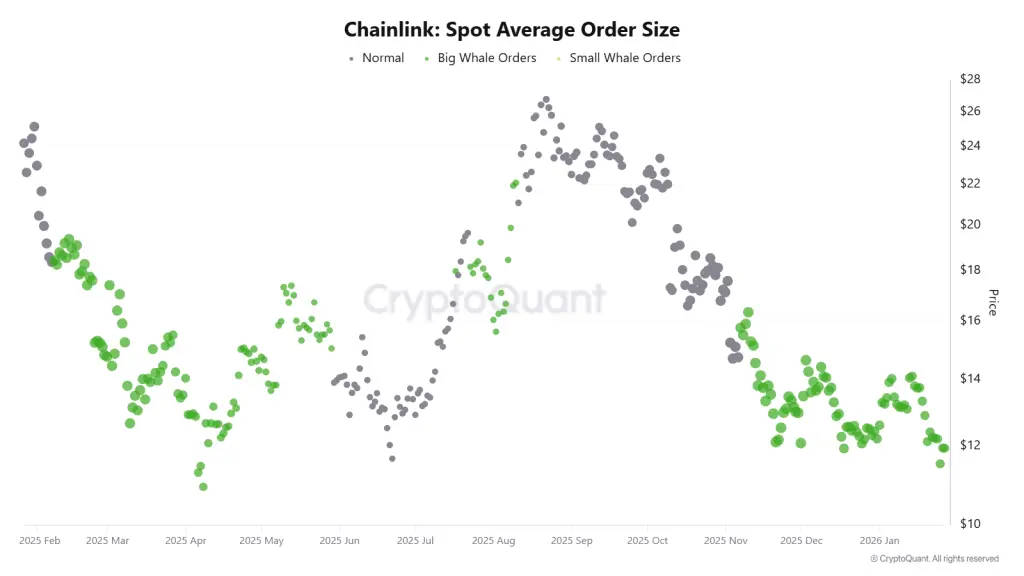
 Beyond treasury data, on-chain metrics add another layer. Exchange reserves and whale activity have both trended higher, signaling accumulation rather than distribution
 Collectively, these dynamics support a constructive long-term view for LINK crypto, even as short-term price weakness persists.
Why Institutions May Be Waiting for Lower LINK Price Levels
That said, institutional participation often comes with a preference for discounted entry points or simple they look for “dirt cheap prices”. Despite visible accumulation, price behavior suggests maybe institutional buyers are not yet satisfied
Historically, large entities tend to scale positions during drawdowns rather than during strength, and the current LINK price chart appears to reflect that pattern.
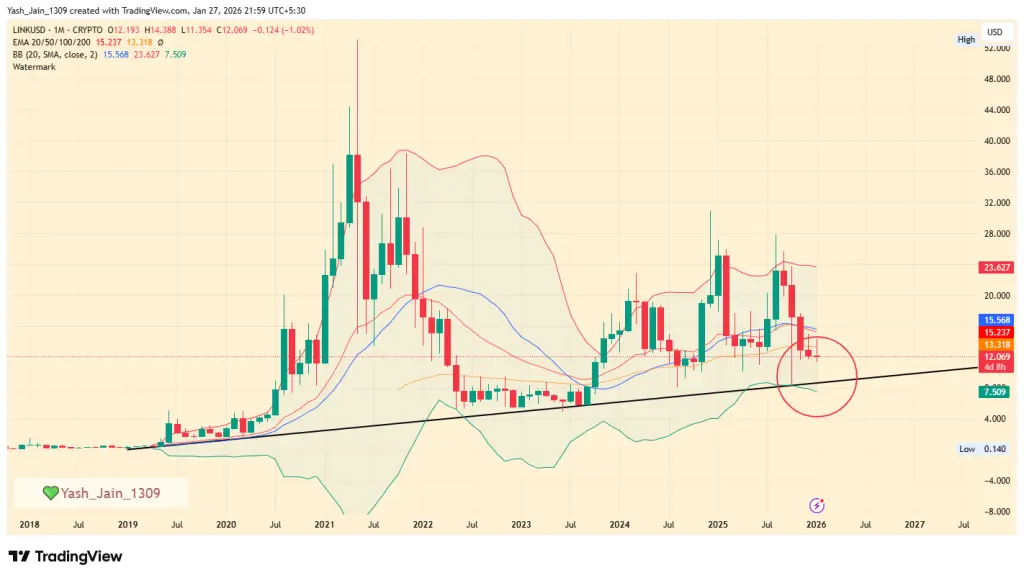 From a broader technical angle, LINK crypto’s monthly structure shows that major uptrends have typically started only after a decisive monthly closing candle on its long-term ascending trendline. That confirmation has not occurred since 2023. The current decline may therefore represent the type of drawdown institutions often seek before re-engaging more aggressively.
LINK Price Chart Signals Risk of Further Decline
From a technical perspective, several indicators continue to lean bearish. The monthly Bollinger Bands show room toward the lower band, while the MACD has printed a bearish cross. Meanwhile, the RSI slipping below 50 suggests weakening bullish momentum.
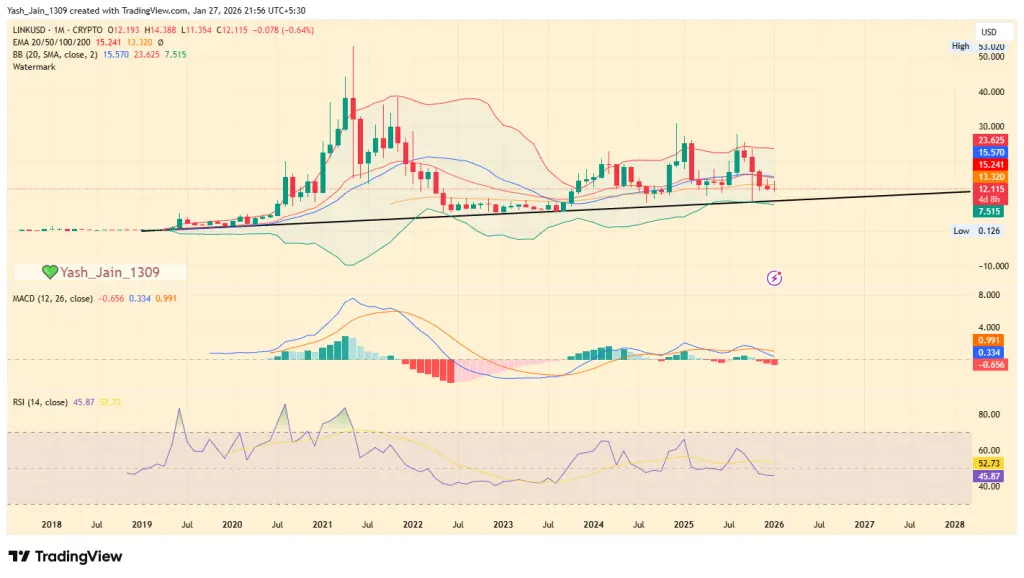 Technically, dynamic support aligns near the $8.75–$9.00 zone, roughly 25% below current levels. If price revisits this region, it would align with historical accumulation phases seen before prior multi-month recoveries. In that context, the current setup suggests the LINK price forecast narrative remains vulnerable in the near term, even as longer-term fundamentals remain intact.
Disclaimer: The information on this page may come from third parties and does not represent the views or opinions of Gate. The content displayed on this page is for reference only and does not constitute any financial, investment, or legal advice. Gate does not guarantee the accuracy or completeness of the information and shall not be liable for any losses arising from the use of this information. Virtual asset investments carry high risks and are subject to significant price volatility. You may lose all of your invested principal. Please fully understand the relevant risks and make prudent decisions based on your own financial situation and risk tolerance. For details, please refer to
Disclaimer.
Related Articles
Tether Withdraws 951 BTC Worth $70.47M from Major CEX, Holds $7.2B in Bitcoin Reserves
Tether's BTC reserve address withdrew 951 BTC valued at $70.47 million, part of Q1 2026 purchases. It now holds 97,141 BTC worth around $7.2 billion, making it the fifth-largest BTC wallet with unrealized gains of $2.175 billion.
GateNews48m ago
BTC 15-minute drop of 0.62%: Exchange net inflows and liquidity depletion in sync trigger selling pressure
2026-04-15 14:30 to 2026-04-15 14:45 (UTC), the BTC price’s return over 15 minutes was -0.62%. The quoted range was 73,905.4 to 74,448.0 USDT, with a swing of 0.73%. Market volatility quickly intensified, drawing widespread attention from investors, and short-term trading activity became active.
The main driver behind this unusual movement was BTC net inflows to exchanges. On-chain data shows that during this period, about 6 BTC ($420,690) moved into exchanges, combined with the fact that the market’s overall order book depth has been continuing since February
GateNews2h ago
Bitcoin, Ethereum and Solana ETFs Record Positive Net Inflows on April 15
Gate News message, according to the April 15 update, Bitcoin ETFs recorded a single-day net inflow of 4,566 BTC (approximately $337.41 million) and a 7-day net inflow of 6,753 BTC (approximately $499.04 million). Ethereum ETFs saw a single-day net inflow of 23,405 ETH (approximately $54.37 million)
GateNews3h ago
BTC 15-minute drop of 0.70%: Increased ETF fund outflows and a coordinated sell-pressure trigger from derivatives position adjustments
From 2026-04-15 13:30 to 13:45 (UTC), the BTC price fluctuated within the range of 73,846.3 to 74,415.9 USDT. Within 15 minutes, the return recorded -0.70%, with an amplitude of 0.77%. During this period, market volatility intensified, trading volume and on-chain transfers heated up significantly, and market participants’ risk sensitivity increased.
The main driving force behind this unusual move was a sharp increase in ETF fund outflows. Data shows that on 2026-04-13, U.S. spot Bitcoin ETFs recorded net outflows of -231.7 million dollars, far above the one-week average
GateNews3h ago
Canaan Creative Reports 89 BTC Mining Output in March, Holdings Reach 1,808 BTC
Canaan Creative reported producing 89 BTC in March 2023, with total holdings of 1,808 BTC and 3,952 ETH. The company increased its global mining capacity by over 10 megawatts, reaching a total of 266.3 megawatts.
GateNews3h ago
Strive Raises SATA Dividend to 13%, Adds 27 Bitcoin to Bring Total Holdings to 13,768 BTC
Strive, a Nasdaq-listed bitcoin treasury company, is raising its Series A Preferred Stock dividend to 13.00%. It also acquired 27 additional bitcoins, totaling 13,768 BTC, ensuring dividend payments can be supported for about 19.6 years.
GateNews4h ago
