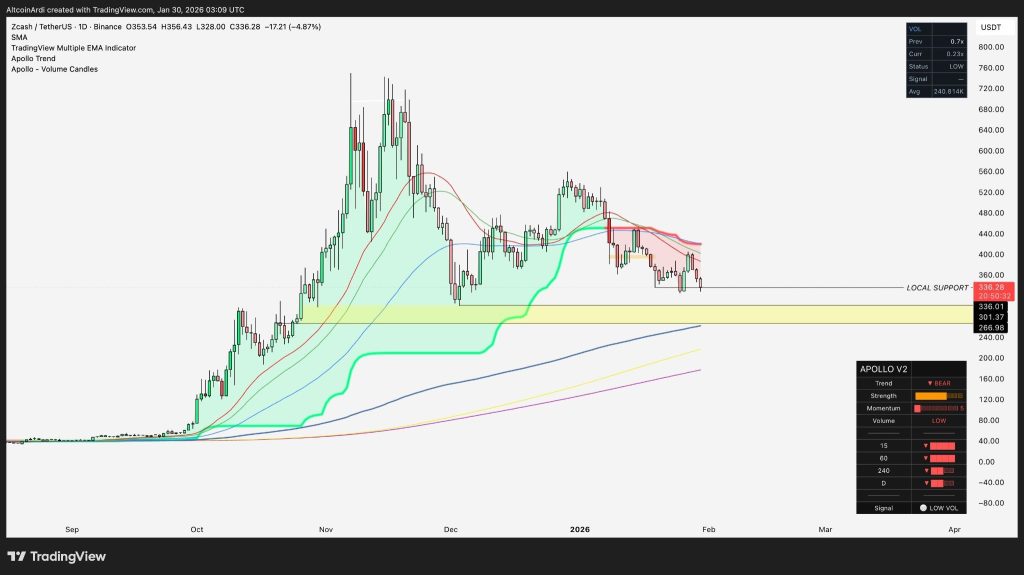
Zcash is starting to lean heavily on local support after another rough daily candle, with price hovering around $336. On the chart, that support line is basically the last thing stopping a deeper slide.
Price is also trading below the key moving averages, and the faster EMAs are stacked overhead, acting like a lid every time ZEC tries to move up.
The Apollo readout doesn’t help much either. Trend is marked as bear, and volume is still low. That usually means buyers aren’t stepping in with much confidence yet, which is why support levels like this tend to get tested again instead of producing an instant bounce.
ZEC Price Eyes the $300 Liquidity Zone
Ardi’s take is pretty direct. If this local support gives way, the ZEC price likely slides toward the $300 area. From a structure point of view, that makes sense. There’s not a lot of meaningful support between where price is now and that round-number zone.
It’s also not just about $300 exactly. The real area to watch is the broader $290–$300 range, which often acts like a liquidity pocket. If the ZEC price dips into that zone and snaps back quickly, it can turn into a classic flush-and-bounce move. If price drifts into it and struggles, the market usually starts looking lower pretty fast.
Source: X/@ArdiNSC
Another level that stands out is $310, which lines up with the 61.8% Fibonacci retracement of the move from $40 to the local highs. This is one of those levels where traders expect at least some kind of reaction.
If the ZEC price can’t bounce around $310 and the $290–$300 area doesn’t hold either, that’s when things start to feel heavier. At that point, the next logical downside area becomes the 200-day SMA near $270, which is the next clear technical reference on the chart.
Zcash (ZEC) Price Reaches a Key “Moment of Truth” – Is a Bullish Pennant Forming?_**
If Buyers Don’t Step In, $200 Comes Into View
This is where the risk really opens up. A weak response in the $290–$310 zone raises the odds of a much deeper pullback. In that scenario, the 78.6% Fibonacci level near $200 starts to come into play as a realistic downside target.
Right now, the ZEC price is sitting right at the decision point. Hold this local support and a bounce setup stays alive. Lose it cleanly, and attention shifts quickly to $310, then $300, with the big question being whether buyers finally step in with conviction or let price keep bleeding lower.
Disclaimer: The information on this page may come from third parties and does not represent the views or opinions of Gate. The content displayed on this page is for reference only and does not constitute any financial, investment, or legal advice. Gate does not guarantee the accuracy or completeness of the information and shall not be liable for any losses arising from the use of this information. Virtual asset investments carry high risks and are subject to significant price volatility. You may lose all of your invested principal. Please fully understand the relevant risks and make prudent decisions based on your own financial situation and risk tolerance. For details, please refer to
Disclaimer.
Related Articles
Why XRP Price Risks Further Decline Despite Recovery Signs
Recent XRP price action shows a market that looks steady on the surface but still carries underlying pressure. XRP currently trades around $1.43, up about +0.70% over the past 24 hours and roughly +2.33% across 30 days, yet it remains down about 3.97% over the past week.
That mixed
CaptainAltcoin14m ago
K33: Bitcoin Consolidation Range Selling Pressure Weakens, Market May Be Transitioning from Distribution Phase to Bottom-Building Phase
K33 research report states that Bitcoin has recently oscillated within the $60,000 to $75,000 range, with weakening selling pressure in the market, displaying characteristics of establishing a bottom. Long-term holders tend to accumulate coins, which helps stabilize prices, but macroeconomic uncertainty remains, which may impact risk appetite and capital inflows.
GateNews40m ago
Bullish Signal for Altcoin Price Pump Flares, Crypto Community Expects Altseason to Commence Soon
Bullish signal for altcoin price pump flares.
Expert highlights two bullish signals of altcoin and BTC price charts.
Crypto community expects altseason to commence soon.
The crypto community has been waiting for the altseason peak phase for what feels like over two years now, as the pri
CryptoNewsLand1h ago
Polkadot Faces Risk of Sharp Decline as Negative Signals Intensify
Polkadot (DOT) price continues to extend its downtrend, falling below the $1.40 threshold as recorded on Wednesday, following a slight weakening in the previous session. This downward momentum is reinforced by a weakness in derivatives indicators, along with a series of increasingly negative technical signals, indicating ris
TapChiBitcoin1h ago
SOL Is on Its Way to $102 As Ascending Channel Shows Altcoin Ready to Pump 110% Surge: Analyst
Solana (SOL) shows potential for price increase as it stabilizes within an ascending channel, indicating strong buying momentum. Currently priced at $92.48, SOL could rise to $102 if it breaks resistance, with market optimism supported by a bullish index rise.
BlockChainReporter1h ago
